Phytanoyl-CoA dioxygenase Structure
Originally, the structure of our protein was experimentally defined (by Zhang, Z., Butler, D., McDonough, M.A et.al.) via X-ray diffraction.
Name - Phytanoyl-CoA dioxygenase (PHYHD1)
Classification - Oxidoreductase
Resolution (Amstrongs) - 1.90
R-Value - 0.221 (obs, relatively low)
Space Group - P 3.1 2 1
Unit Cell Paramters (Amstrongs) - a = 91.97, b = 91.97, c = 81.61
Unit Cell Angles - alpha = 90.00, beta = 90.00, gamma = 120.00
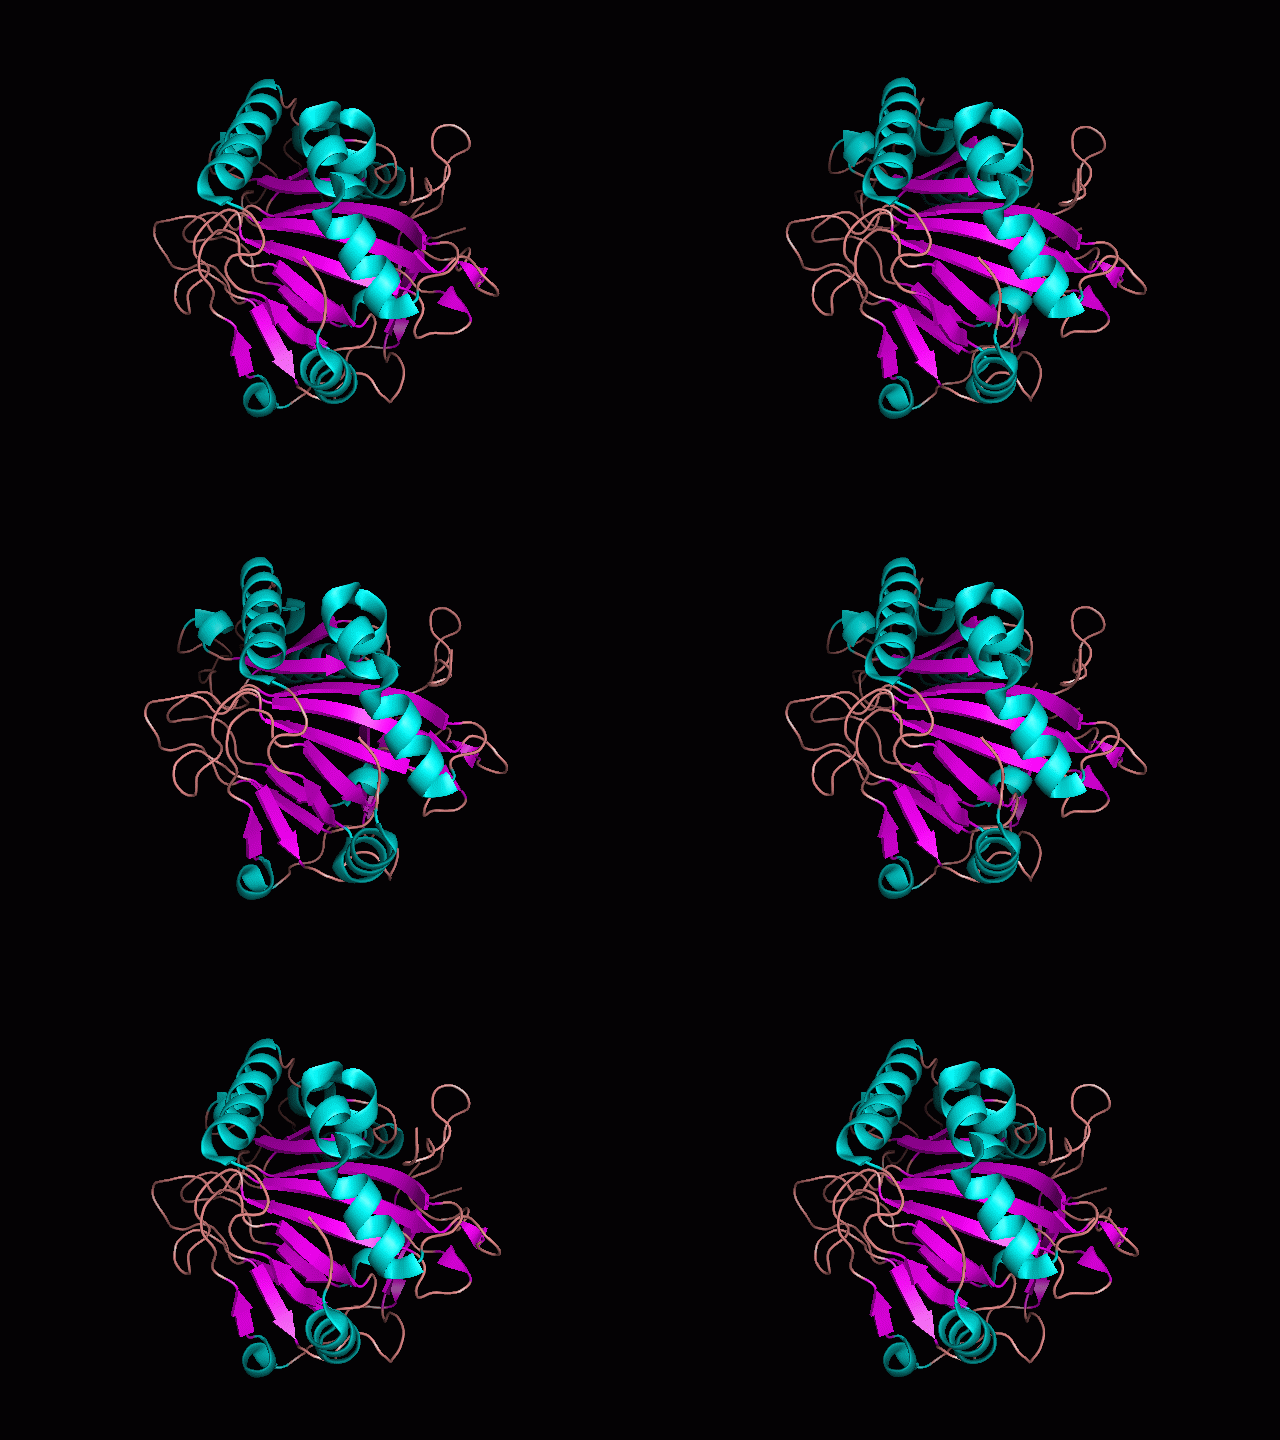
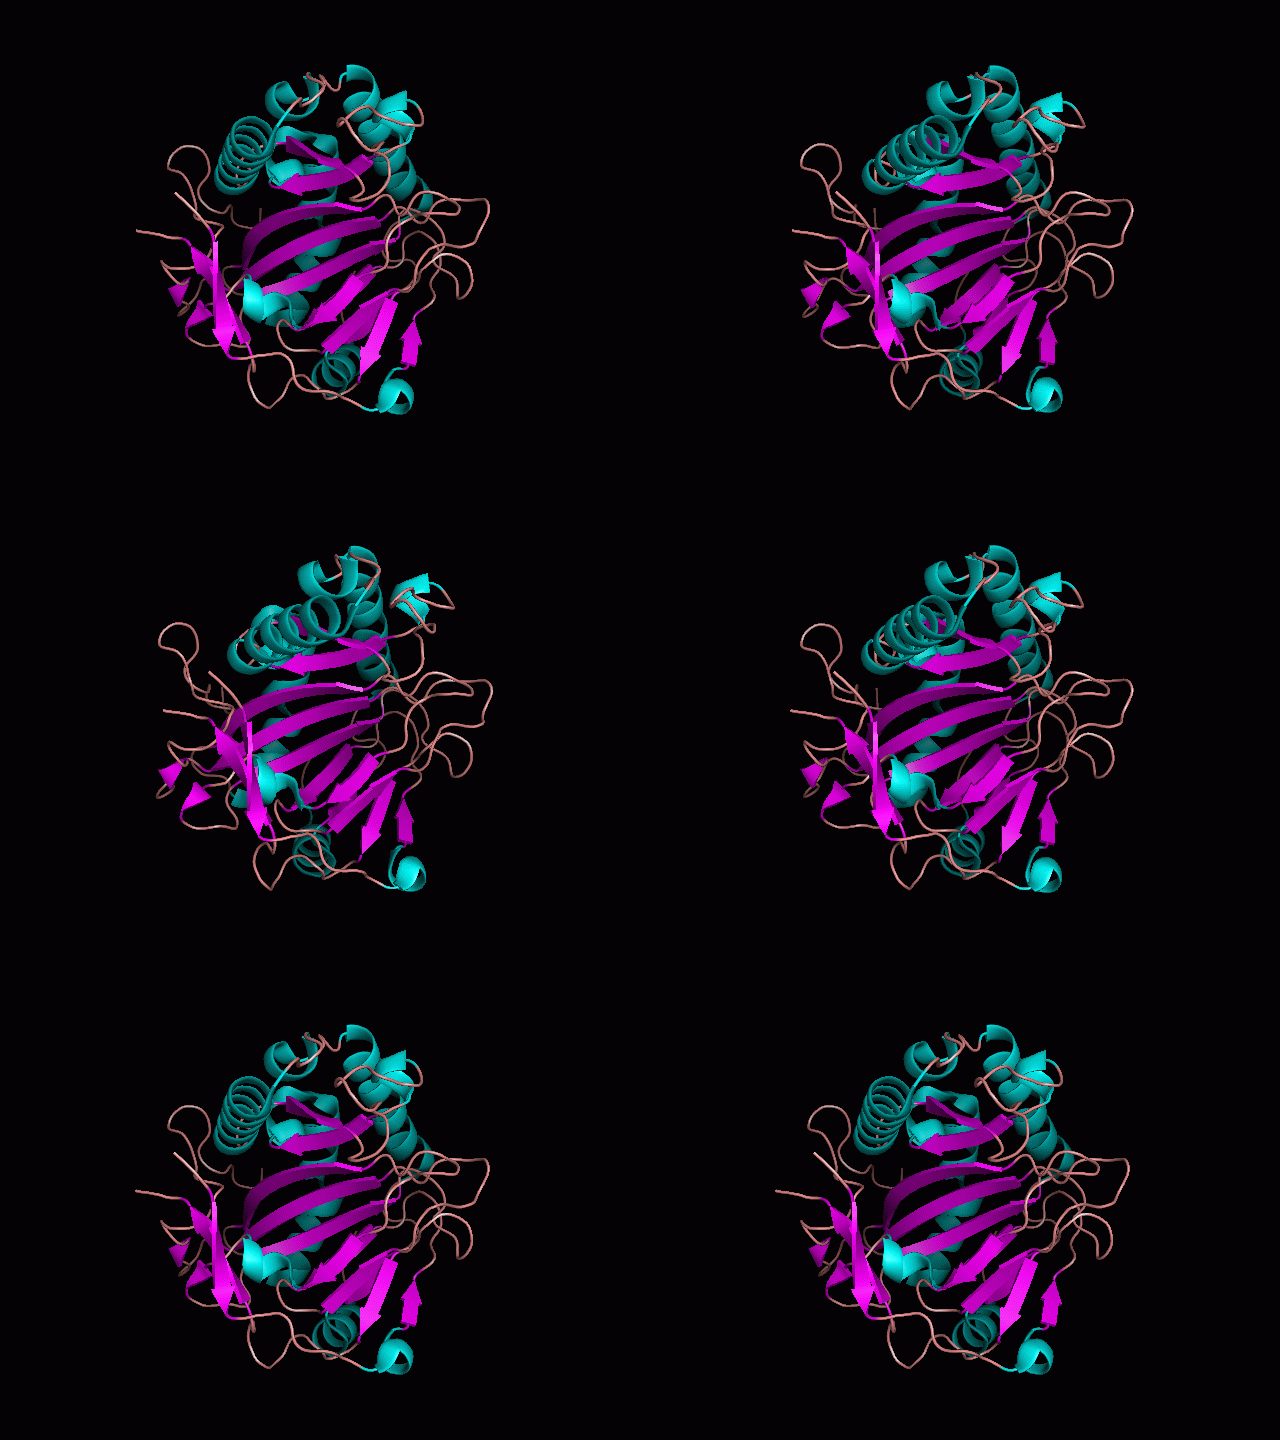
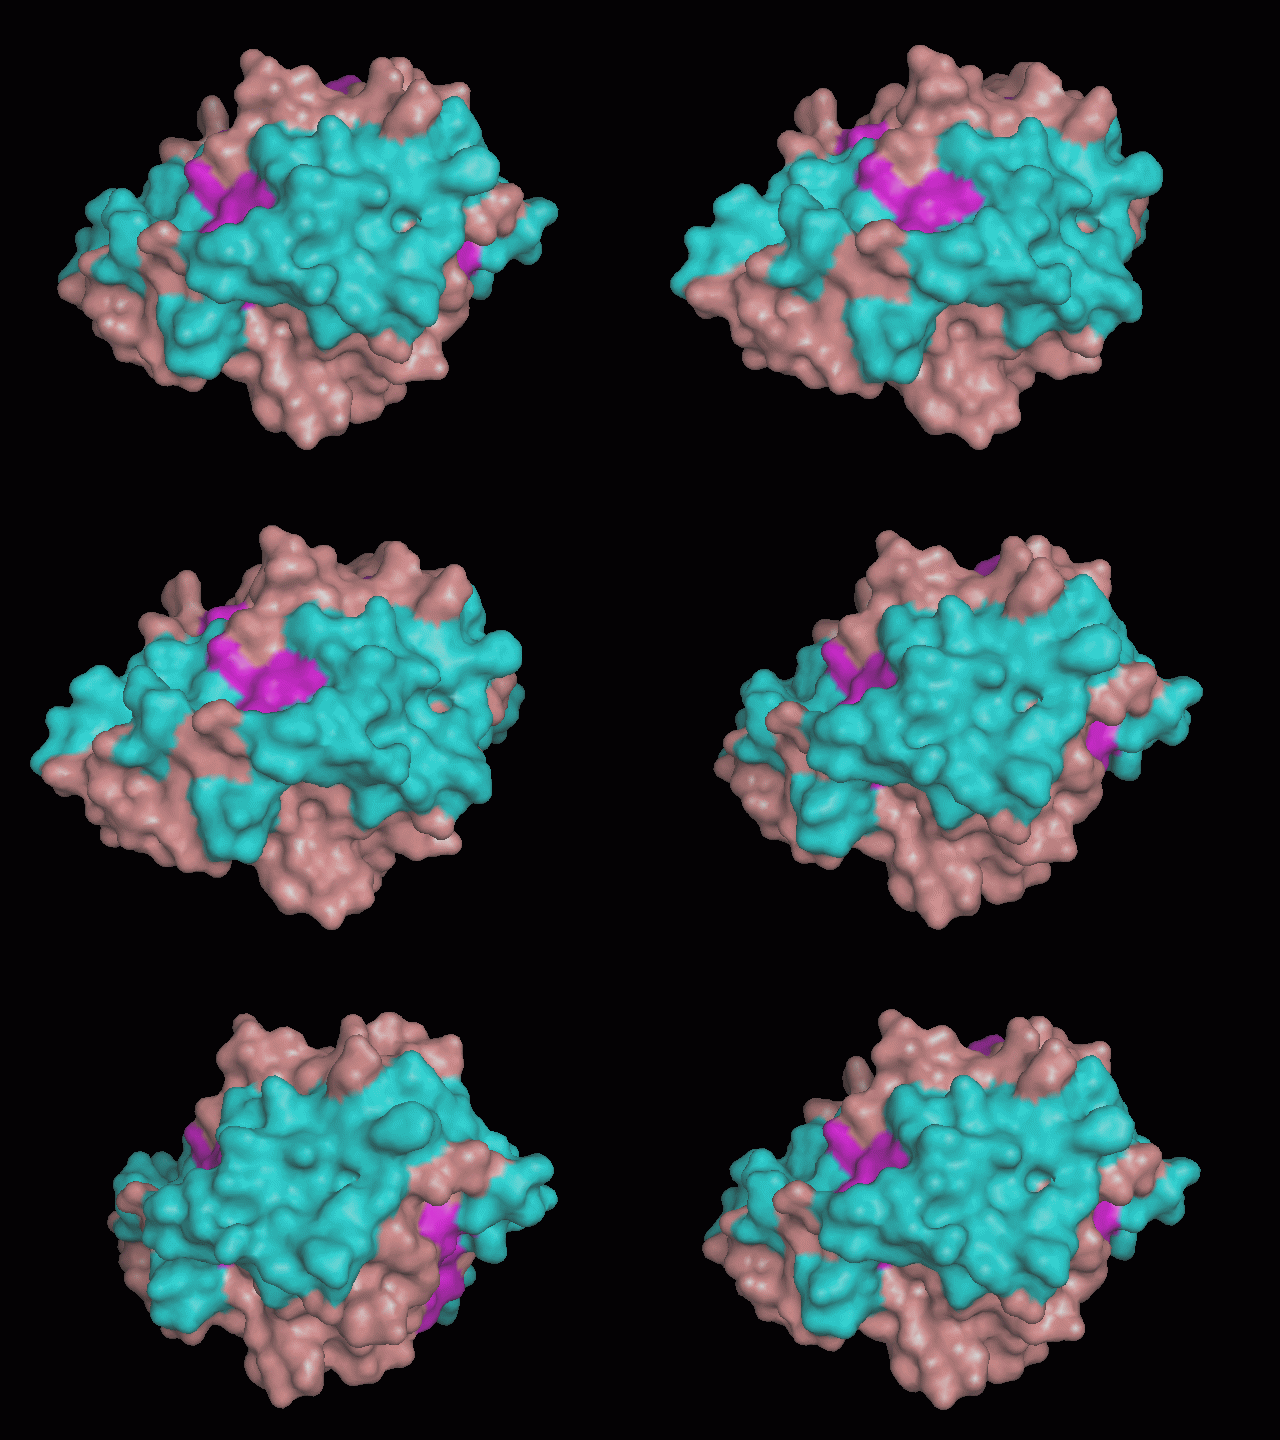
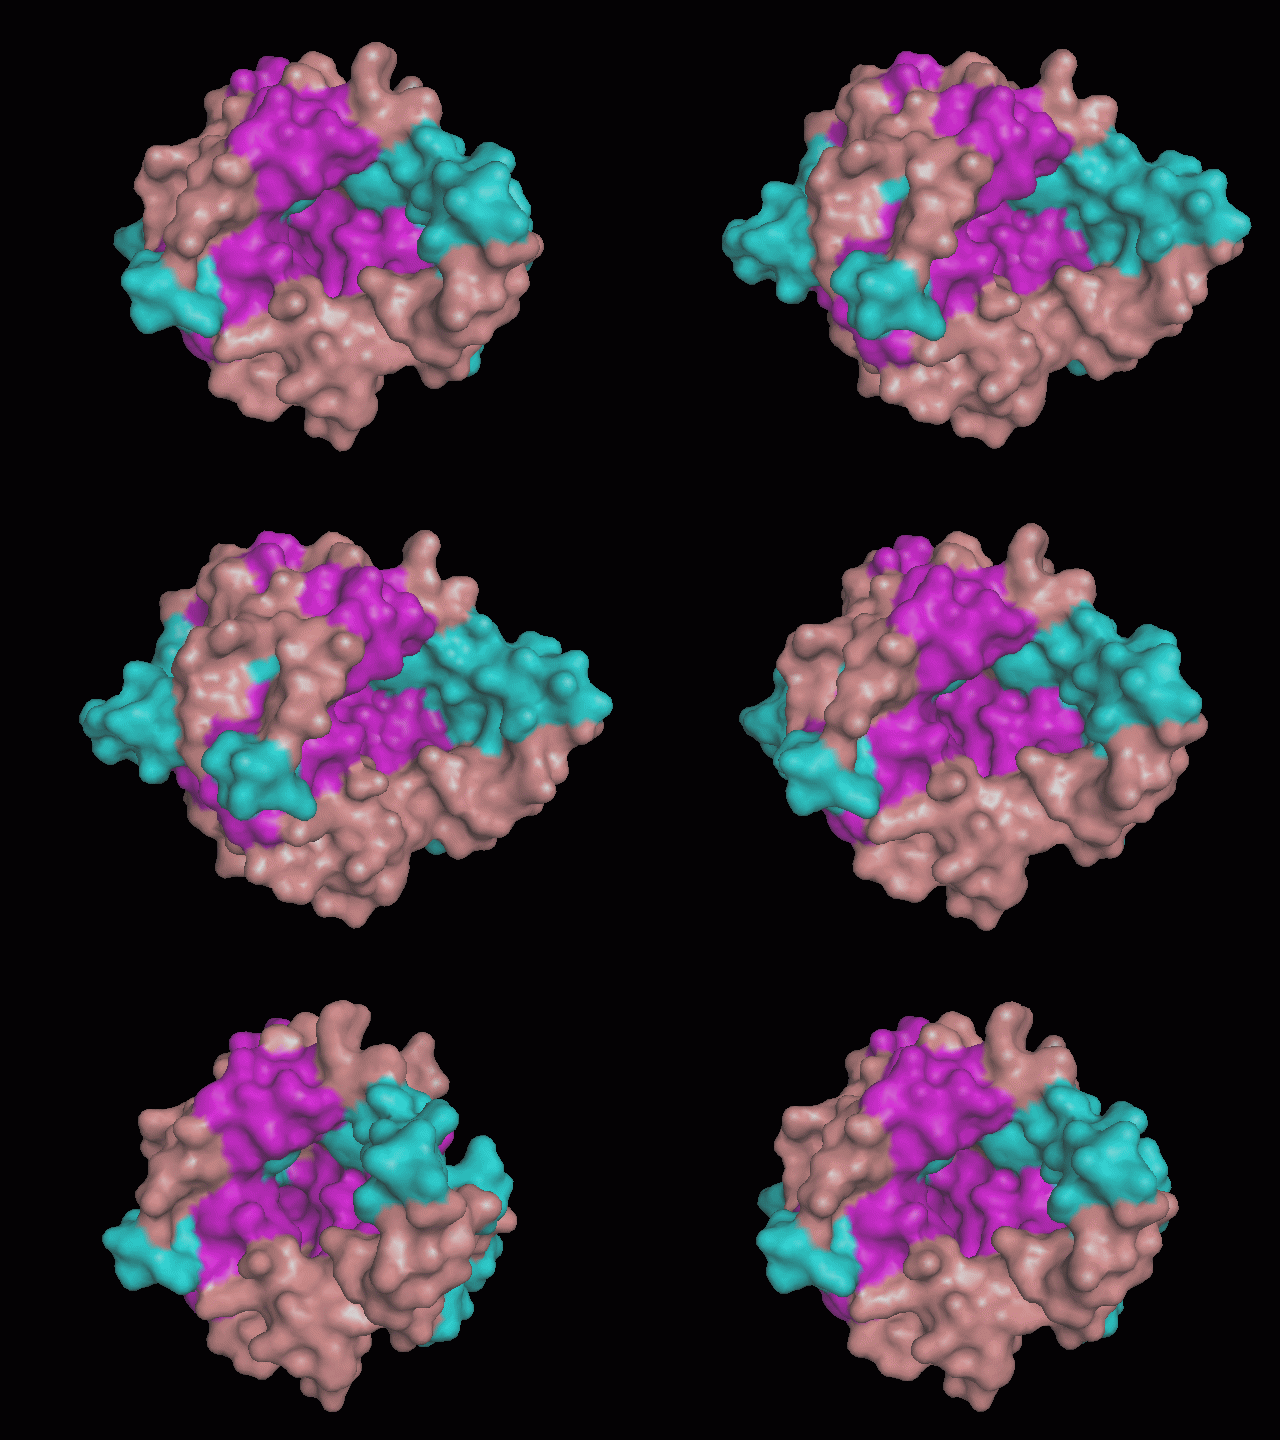
Using Pymol the image was visualized to get a general overview of the protein. These are below.
There are high levels of steric hinderance if the approaching ligand comes from behind the molecule (figure 1, figure 3).
There is a large hole in the structure of our protein (figure 2, figure 4). As steric hinderance is low and the surface area is maximized at this position, it would seem that this area should encompass the binding sites of our protein, or at least be the location of some form of interaction. The fact such a definitive hole in the structure of the protein exists lead us to investigate further properties around this region. Liam will go into more details as to the function of the binding sites and a comparison to a similar protein in his section.
Promotif returned the following list of structural features.
4 Sheets
3 beta-hairpins
4 beta bulges
15 strands
10 helices
6 helix-helix interactions
24 beta turns
1 gamma turn
It should be noted that a large proportion of the alpha helices are located on the outside of the protein, while the core is mostly composed of beta sheets. One beta sheet is composed of 7 strands, this makes up most of the protein core. These structural characteristics are further shown in the topology maps below.
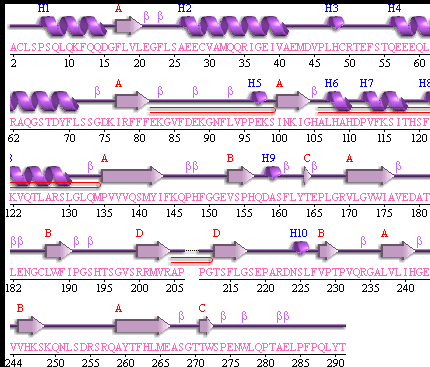
Showing the topology of the protein. Reproduced from the European Bioinformatics Institute,
http://www.ebi.ac.uk/thornton-srv/databases/pdbsum/2opw/domA01.gif
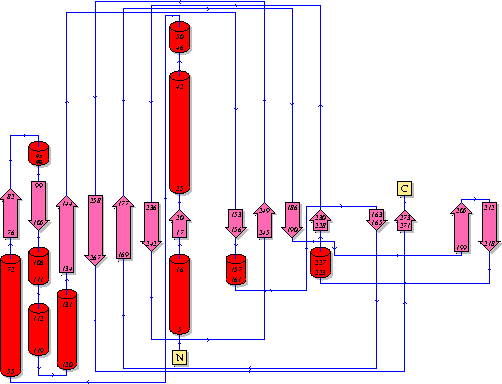
Showing another topology of the protein. Reproduced from the European Bioinformatics Institute,
http://www.ebi.ac.uk/
