Cellular Context (location): Difference between revisions
From MDWiki
Jump to navigationJump to search
HayleyThomas (talk | contribs) No edit summary |
HayleyThomas (talk | contribs) No edit summary |
||
| Line 8: | Line 8: | ||
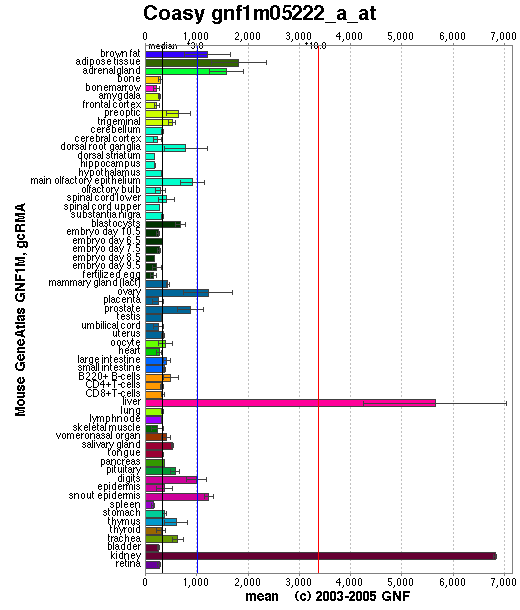
'''Figure One: Expression profile for CoA Synthase'''. Reproduced from GNF SymAtlas (http://symatlas.gnf.org/SymAtlas/symquery?q=71743) | '''Figure One: Expression profile for CoA Synthase'''. Reproduced from GNF SymAtlas (http://symatlas.gnf.org/SymAtlas/symquery?q=71743) | ||
CoA synthase is expressed in all tissues. This makes sense, because CoA is used in all tissues in the TCA cycle. | |||
Levels of CoA synthase are very high in the liver. This is probably because more CoA is needed in the | |||
Revision as of 06:24, 15 May 2007
The expression profile of bifunctional CoA synthesis is consistent with its function. This expression profile is shown in Figure One.
Figure One: Expression profile for CoA Synthase. Reproduced from GNF SymAtlas (http://symatlas.gnf.org/SymAtlas/symquery?q=71743)
CoA synthase is expressed in all tissues. This makes sense, because CoA is used in all tissues in the TCA cycle.
Levels of CoA synthase are very high in the liver. This is probably because more CoA is needed in the
