Discussion of SNAPG

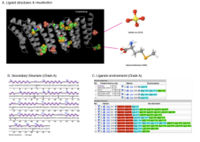
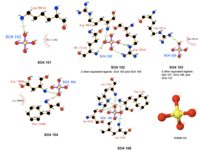
nanti aku mau jelasin ttg ligandnya
Tea: evolution linked with function.
SNAP-gamma protein evolutionary tree mostly contains more than 75% boostrapvalue. Thus, red dot signs was assign to represent more than 75% boostrap value. The value was indicated the degree of confidence about the branching order. As an example: in the diagram phylogenetic tree (see Figure 3), there is 39.0 boostrap value in branching Apis melifera and Tribolium castaneum. The boostrap value is below 75%, thus it could be concluded that the degree of confidence of branching tree in the correct order is far below 95%. On the other hand, boostrap value more than 75% or 75.00 means 95% confidence that the branching tree is in the correct order
As indicated in diagram above, SNAP-gamma protein was evolved in eukaryotes. There is no prokaryotes detected in the phylogenetic tree.
Function (in various organism) = nunggu justine
Thus, it could be concluded that SNAP-gamma protein is important protein in eukaryotes animal.
