Result of SNAPG: Difference between revisions
| Line 41: | Line 41: | ||
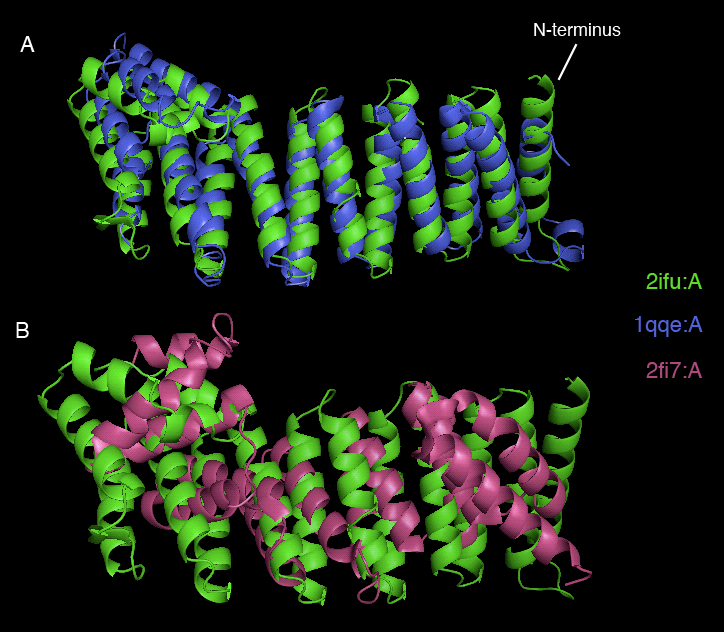
[[image:2ifu structure alognments.png|thumb|left| | [[image:2ifu structure alognments.png|thumb|left|700px|[[Media:2ifu structure alognments.png|Figure 4. Superimposed structures of 2ifuA with 1qqeA (A) and 2ifuA with 2fi7A (B) generated by PyMOL. The 2ifuA is shown in green, 1qq3A in blue and 2fi7A in purple color.]]]] | ||
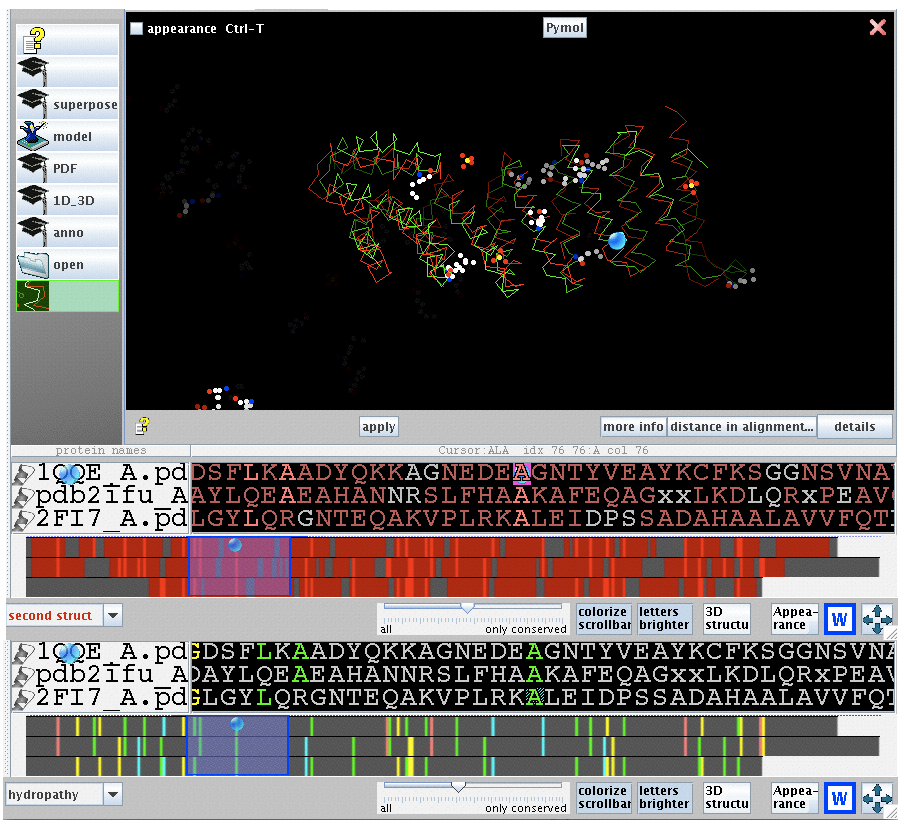
[[image:2ifu 1qqe 2fi7 alignment.png|thumb|left|700px|[[Media:2ifu 1qqe 2fi7 alignment.png|Figure 5. Stucture and sequence alignment of 2ifuA, 1qqeA and 2fi7A generated by STRAP. ]]]] | |||
==== physical properties ==== | ==== physical properties ==== | ||
Revision as of 10:30, 11 June 2007
SNAPG Structure
Structure architecture
In order to analyze protein structure of SNAPG, structural comparison to known protein structure is required. An insight to SNAPG structural arrangement provides various informative data on possible protein functions and interactions with another protein and/or DNA. Based on protein families database, Pfam at Sanger, it was found that SNAPG protein matched to Pfam-B protein families and consist of 2 domains, Pfam-B_7270 (PB007270) and Pfam-B_15198 (PB015189) respectively as shown in Figure 3. Both of 2 domains appears to be associated with NSF attachment protein activity (*dijelasin di discussion aja! NSF acivity dijelasin ga?)[1].


. The sequence was also used against InterproScan generated by Profunc that gave an TFR (Tetratricopeptide-like helical) domain classification while that of protein family agrees with Pfam classification.
(interproscan)
Structural comparison
Dali webserver is one of the powerful tool to screen any protein that are structurally homologous with our query. Two structurally related proteins with highest Z-value generated by Dali server were chosen for SNAPG structure comparison analysis. These proteins were vesicular transport ptotein sec17 (1qqe) and type 4 fimbrial biogenesis protein (2f17) (refer to Table 1).alto
| PDB-chain | Structure | Z-value | % identity | Protein |
|---|---|---|---|---|
| 2IFU-A | 37.8 | 100 | Endocytosis/exocytosis. Gamma-SNAP (Danio rerio) | |
| 1QQE-A | 23.3 | 23 | Protein binding. Vesicular transport protein sec17(yeast) | |
| 2FI7-A | 12.9 | 14 | Protein transport. Type 4 fimbrial biogenesis protein pili (Pseudomonas aeruginosa) |


2ifuA, 1qqeA and 2fi7 alignment


physical properties


[[image:Electrostatic potential (molecular surface).png|thumb|left|500px|Figure 9. 2ifuA electrostatic potential map visualised by molecular surface. Computation method that were used are coulumb method.](red= -1.800; white= 0.000; blue= +1.800]
Figure 10 cleft
SNAPG Function
Function by Similarity

SNAPG Evolution
Background
 -> This is the cladogram treeview of SNAP-gamma protein. However, this view is not suitable enough to represent the evolutionary gap between species but this is clearly shows the species name.
Final Tree Analysis

-> Evolutionary analysis of the tree with radial view (for professional viewer)
Legends:
- Red-dotted sign means boostrap value more than 75.00 or 75%
- any number (in red) located near branching tree indicated boostrap value of the branching tree
- Green Line: The species belongs to Plants group
- Brown Line: Amoeba group
- Purple Line: Parasite type
- Pink Line : The species belongs to Insects Group
- Light Green Line: Worms Group
- Dark Blue Line: Invertebrate
- Red Line: Vertebrate
Other version: Evolutionary analysis of the tree with radial view (for non-professional or common viewer)
Other Attributes
List IDs use as an batch entrez input