Sequence analysis of 2qgn: Difference between revisions
From MDWiki
Jump to navigationJump to search
No edit summary |
|||
| (15 intermediate revisions by the same user not shown) | |||
| Line 1: | Line 1: | ||
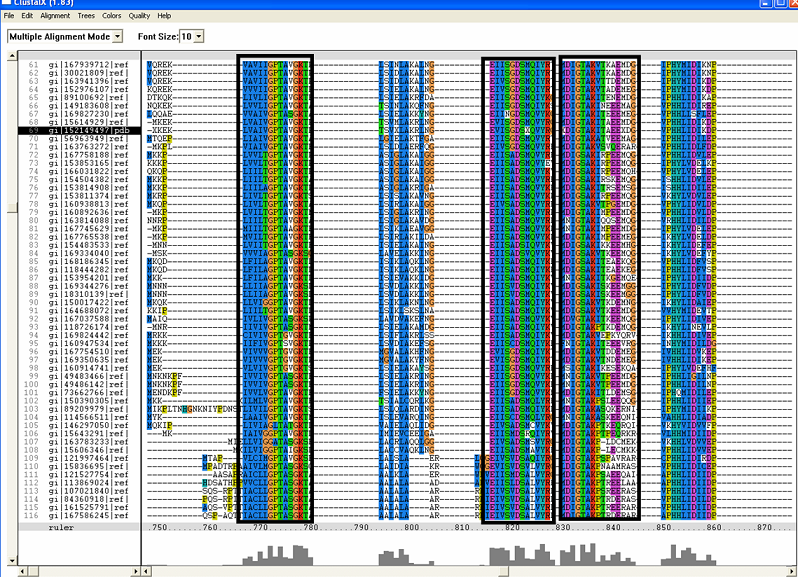
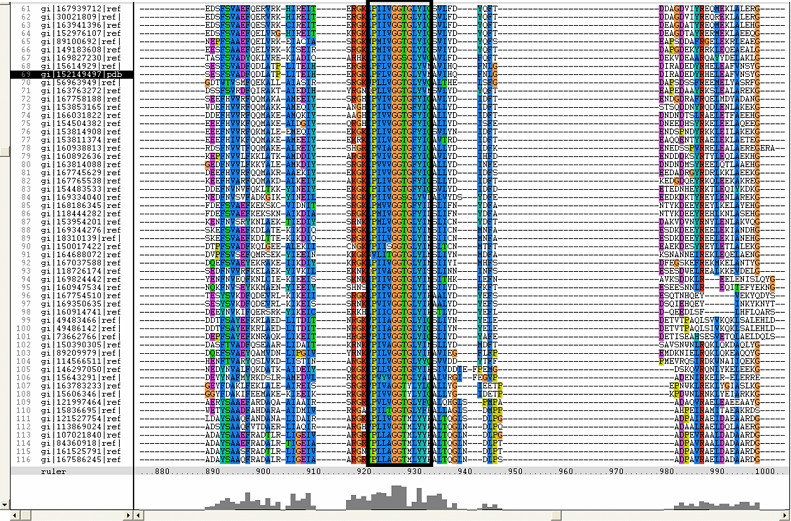
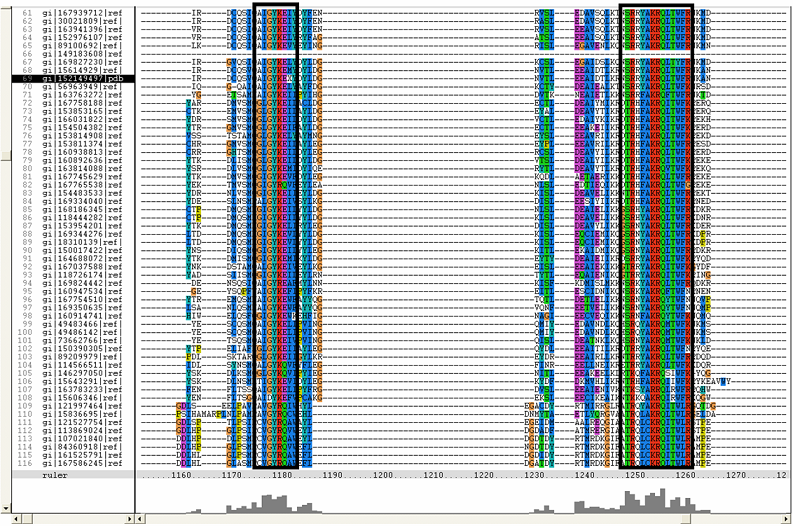
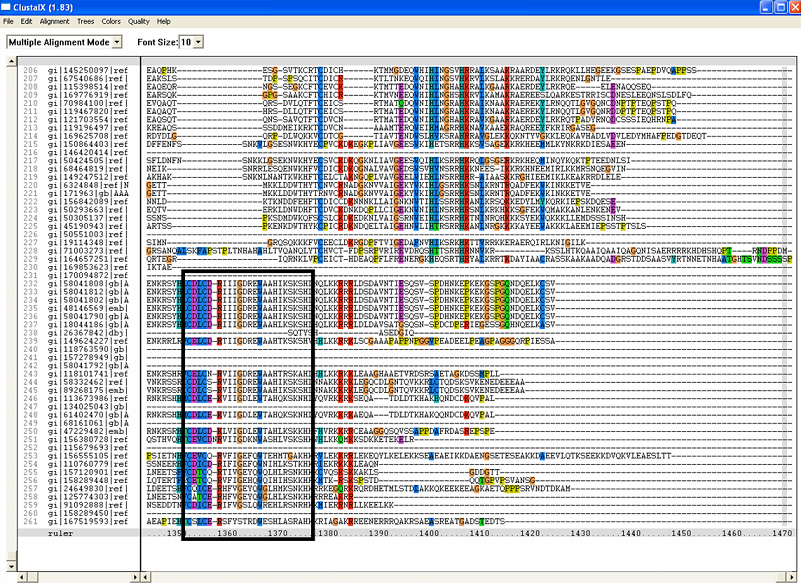
==Multiple Sequence Alignment== | ==Multiple Sequence Alignment== | ||
[[Image:RR1.png|framed|'''(A)''']] | [[Image:RR1.png|framed|'''(A)'''|left]] | ||
[[Image:RR2.png|framed|'''(B)''']] | [[Image:RR2.png|framed|'''(B)'''|left]] | ||
[[Image:RR3.png|framed|'''(C)''']] | [[Image:RR3.png|framed|'''(C)'''|left]] | ||
[[Image:ZZZ.png|framed|'''(D)''' | [[Image:ZZZ.png|framed|'''(D)'''|left|none]] | ||
[[ | ==Tree_FigTree== | ||
[[Image:figtree.PNG]] | |||
[[Image:TTT.PNG]] | |||
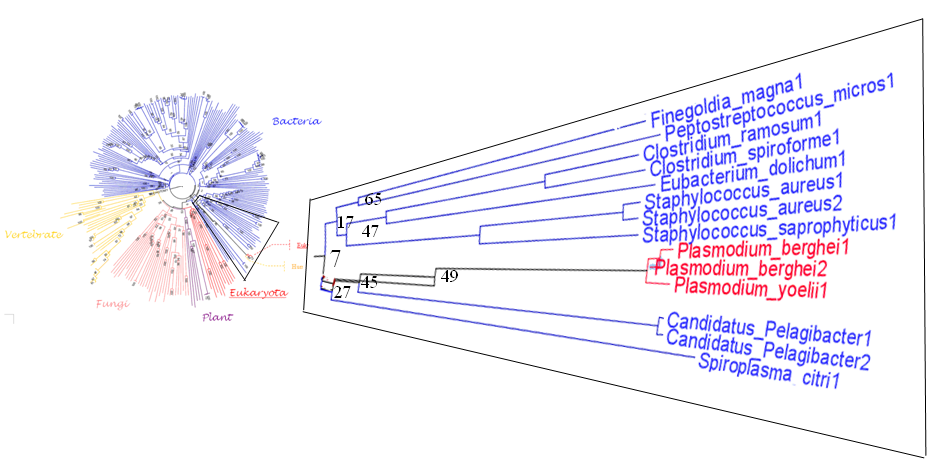
[[Image:plasm.png]] | |||
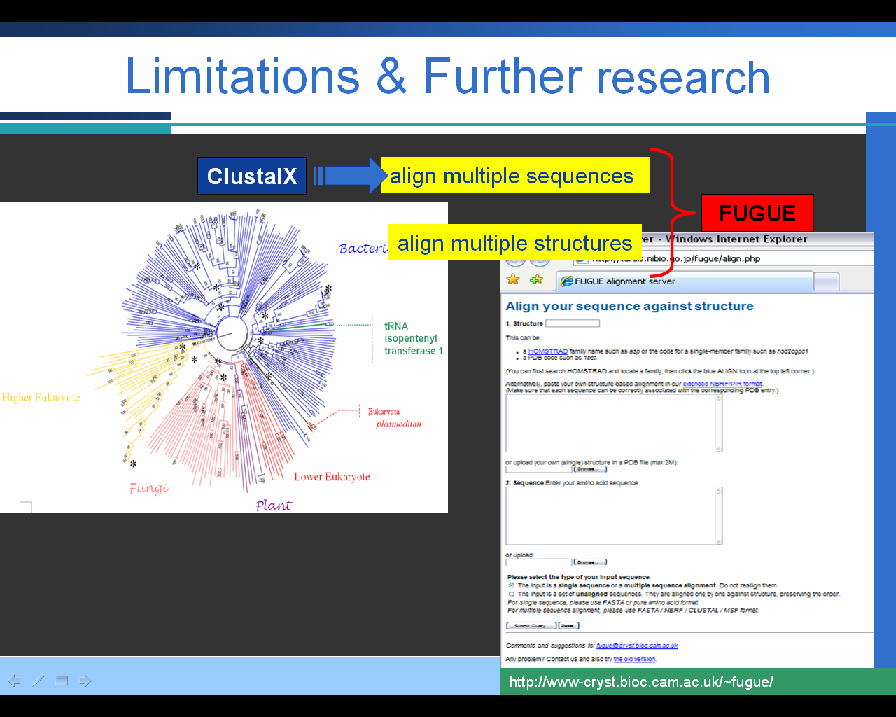
[[Image:fugue.png]] | |||
[[tRNA isopentenyl transferase 1|home page]] | |||
