Structural analysis of 2qgn: Difference between revisions
From MDWiki
Jump to navigationJump to search
Choojinhsien (talk | contribs) |
Choojinhsien (talk | contribs) |
||
| Line 29: | Line 29: | ||
[[Image:Dali output.jpg|framed|none]] | |||
[[Image:Dali output.jpg]] | |||
[[Image:2qgn.png|framed|none]] | [[Image:2qgn.png|framed|none]] | ||
[[Image:2qgn2.png|framed|none]] | [[Image:2qgn2.png|framed|none]] | ||
[[Image:2qgn3.png|framed|none]] | [[Image:2qgn3.png|framed|none]] | ||
Revision as of 10:23, 30 May 2008
Protein Sequence in FASTA format
>gi|152149497|pdb|2QGN|A Chain A, Crystal Structure Of Trna Isopentenylpyrophosphate Transferase (Bh2366) From Bacillus Halodurans, Northeast Structural Genomics Consortium Target Bhr41. XKEKLVAIVGPTAVGKTKTSVXLAKRLNGEVISGDSXQVYRGXDIGTAKITAEEXDGVPHHLIDIKDPSE SFSVADFQDLATPLITEIHERGRLPFLVGGTGLYVNAVIHQFNLGDIRADEDYRHELEAFVNSYGVQALH DKLSKIDPKAAAAIHPNNYRRVIRALEIIKLTGKTVTEQARHEEETPSPYNLVXIGLTXERDVLYDRINR RVDQXVEEGLIDEAKKLYDRGIRDCQSVQAIGYKEXYDYLDGNVTLEEAIDTLKRNSRRYAKRQLTWFRN KANVTWFDXTDVDFDKKIXEIHNFIAGKLEEKSKLEHHHHHH
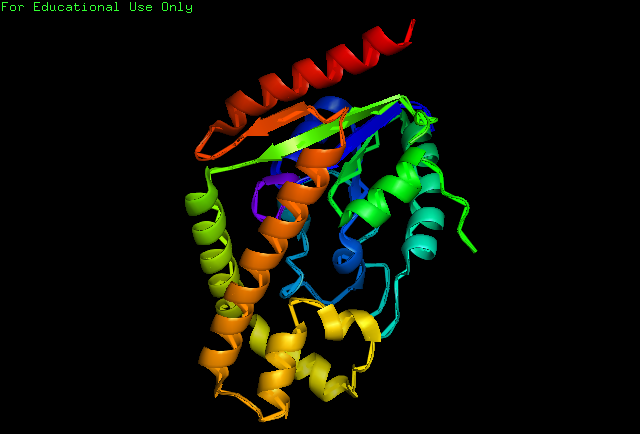
Structure of Protein
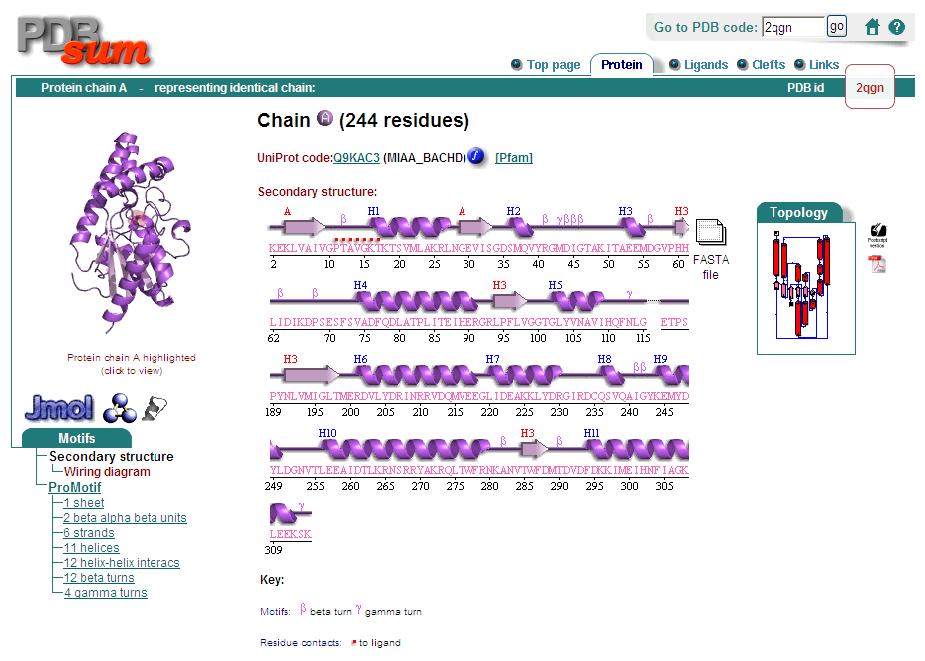
Structural Analysis
Analysis of the secondary structure acquired from Protein Data Bank showed results as displayed below :
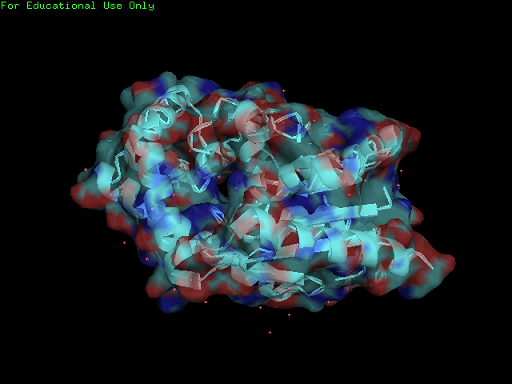
Surface Properties of 2qgn
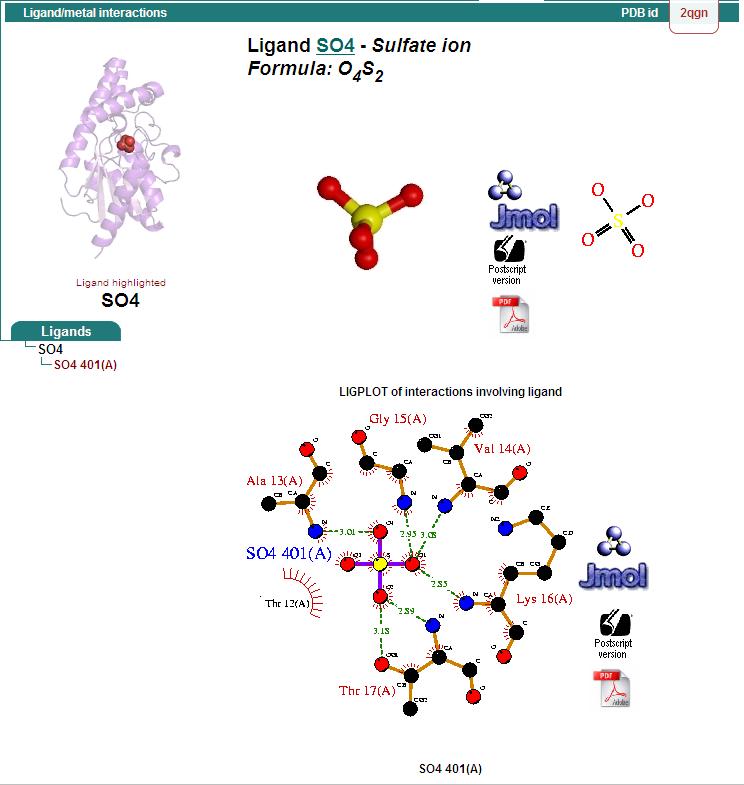
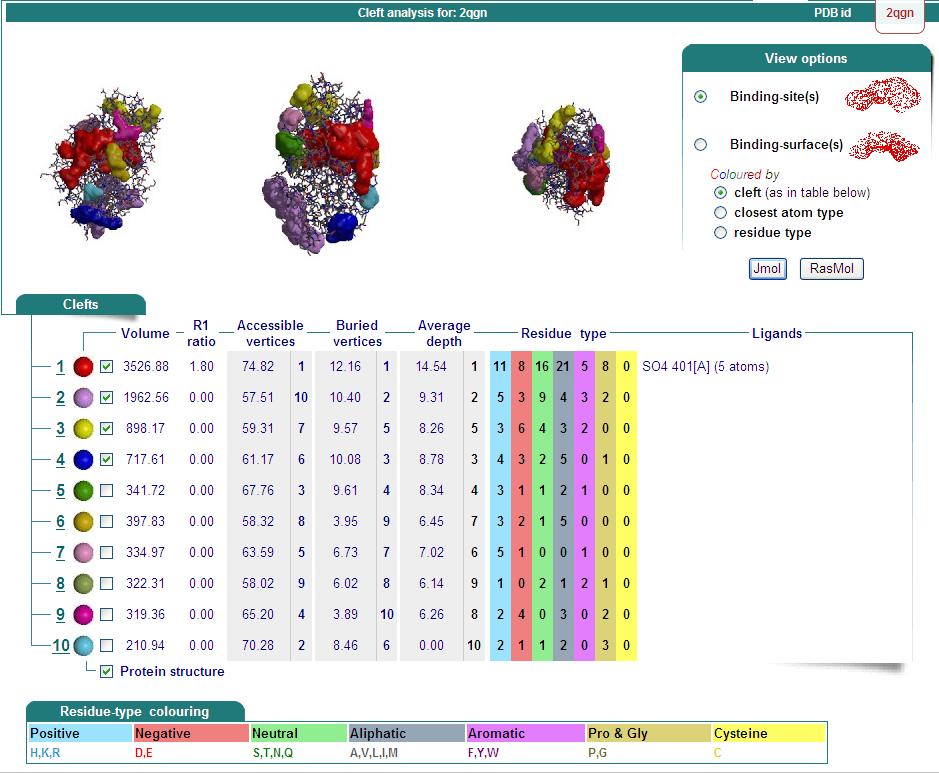
Ligand Binding Sites and Surface Clefts
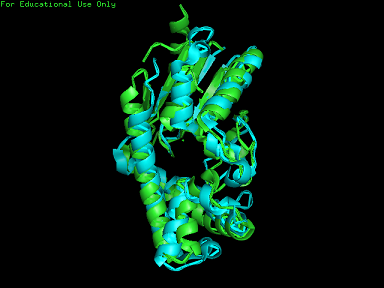
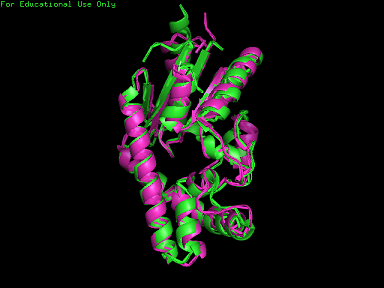
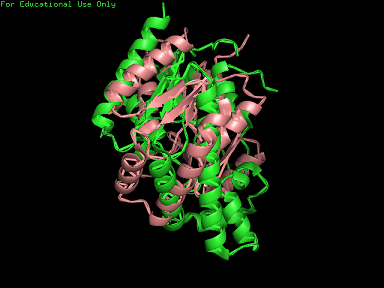
Structural Alignment
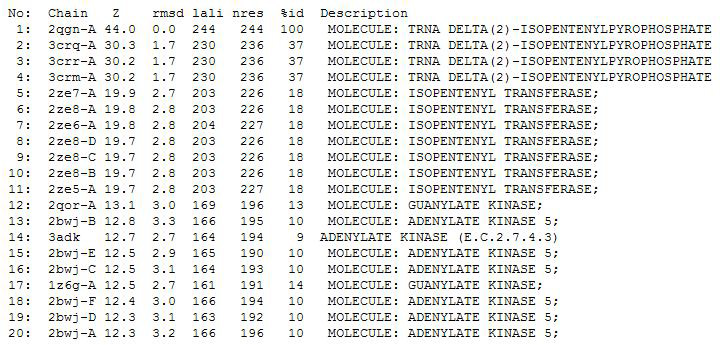
Dali Output
