
Fig 4.1. Shows an example from Wilk et al. (1998)
[1], of how aspartyl aminpeptidase acts upon it's substrate.
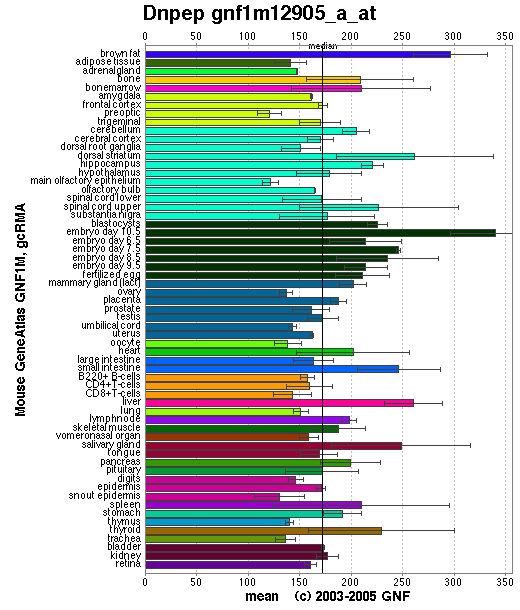
Fig 4.2. Shows that DAP is expressed fairly equally throughout all tissues in a mouse. Provided by SymAtlas, The Novaris Gemomics Institute 2008.
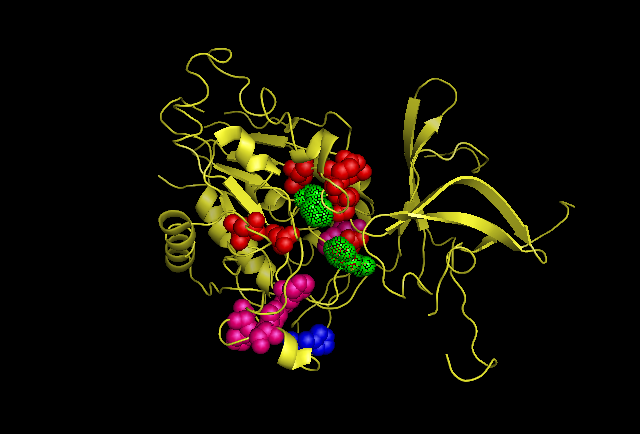
Fig 4.3. This image is chain A. Green shows the predicted active site residues His82 and His401. Pink shows Histidine residues that are also necessary for optimal enzymatic function, and experimentally mutations greatly reduce kcat. Blue is His313 predicted to be involved in subunit-subunit interactions. Red are Aspartyl and Glutamyl residues which are highly conserved across species and thought to participate in catalytic activity.
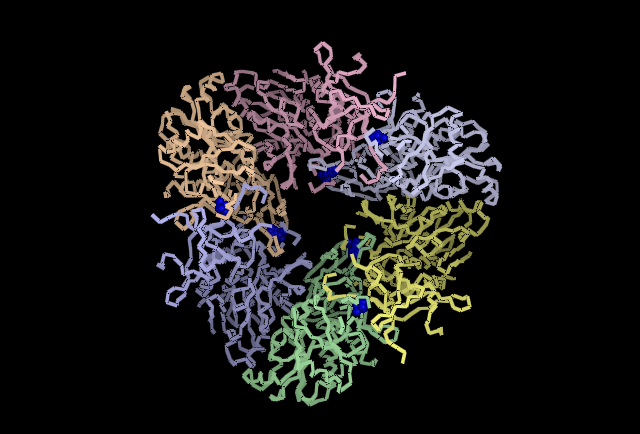
Fig 4.4. Shown in Blue His313 is located where adjacent subunits meet, providing further evidence for a role in subunit-subunit interaction.
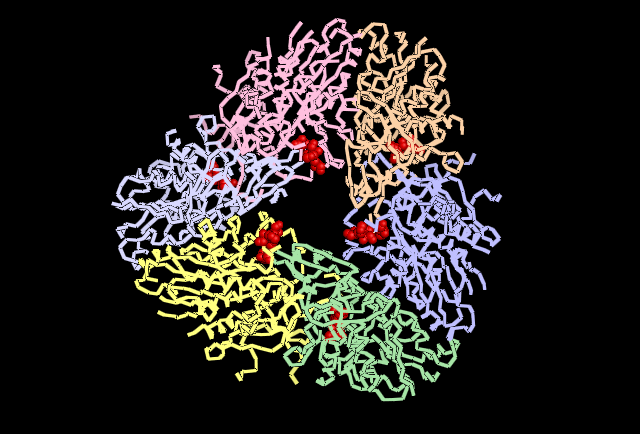
Fig 4.5. Shown in Red the cluster of Histidine residues 310, 320 and 324 are shown in their location around the central channel on the external surface of the tetrahedral structure.
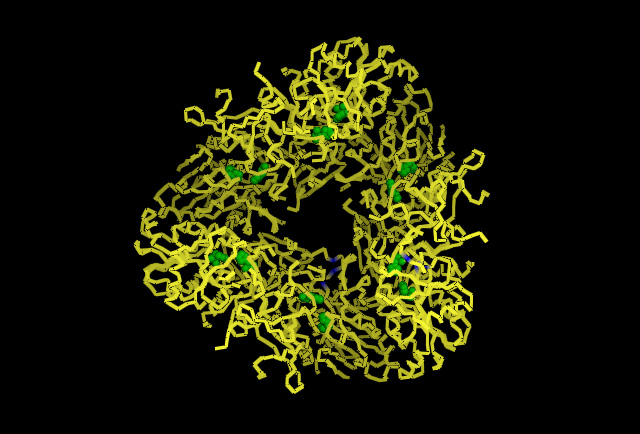
Fig 4.6. Shown in Green the predicted catalytic residues His82 and His401. Six subunits B,G,I,J,K & L have been removed to show the catalytic sites are located internally in the tetrahedral structure.
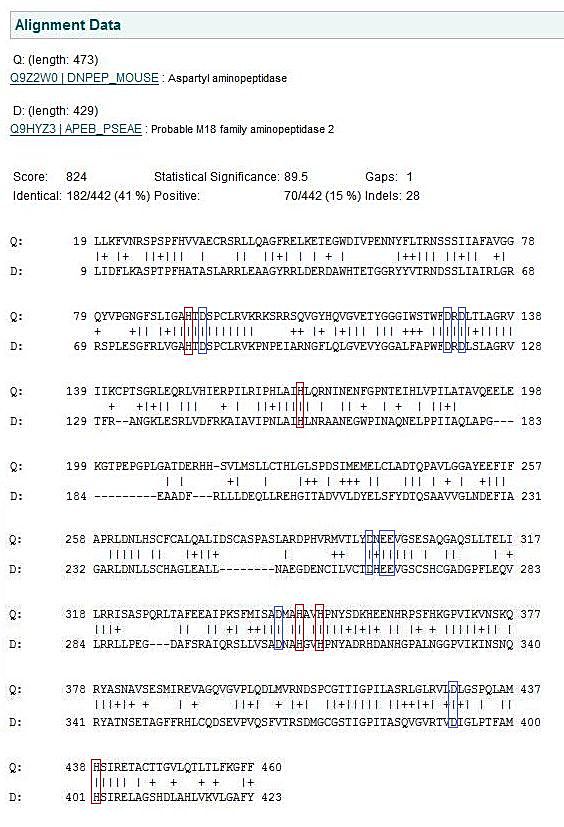
Fig 4.7. A structural alignment between mouse and Pseudomonas show that all the residues that have been predicted to be involved in enzymatic activity have been conserved between the two species despite evolutionary distance.
[2]Return to aspartyl aminopeptidase


