N-myc downstream-regulated gene 2 isoform b
Introduction: The N-myc down regulated gene (NDRG) family belonging to the alpha/beta hydrolase superfamily consists of four members NDRG 1,2 ,3 and 4 where they share 50-60% homology. NDRG is highly conserved in a variety of eukaryotes suggesting functions in cell differentiation and proliferation. Studies have shown that NDRG2 gene is down regulated by Myc proteins via transcriptional repression However, high levels of NDRG2 was observed as Myc expression was reduced in differentiated cells. Myc encodes a transcription factor which binds to DNA of other genes regulating cellular differentiation. Mutations in MYC results in failure of protein to bind correctly to DNA resulting in uncontrolled cell division (cancer).Interestingly, studies have shown that NDRG2 is not repressed by N-myc unlike NDRG1. However, the mechanism in which NDRG2 is not suppressed is still unknown. NDRG2 is a hypoxia responsive gene which induces the apoptosis of tumor cell. To further investigate the structure, function and evolution of NDRG2 an analysis using a range of bioinformatics programs were used.
- Methods:
Structural analysis.
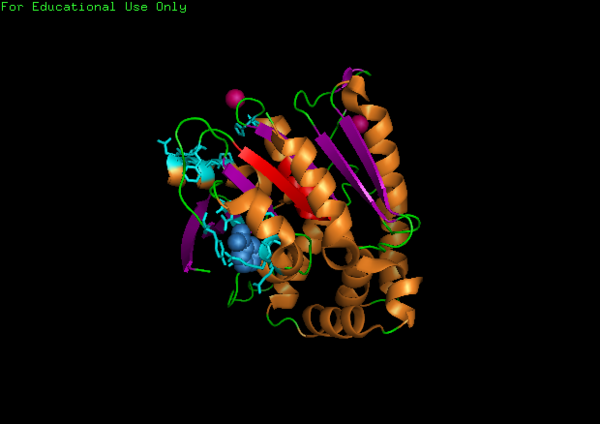
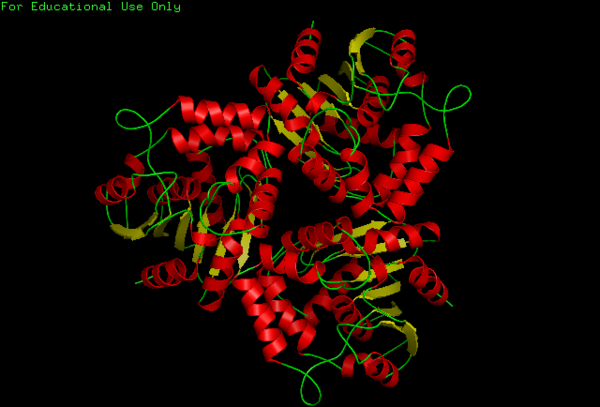
For structure analysis PyMol was used to view PDB structure (2qmq) of N-myc downstream regulated 2. Dali was then used for structural comparison of our protein with other proteins with similar or closely related structure. A secondary structure matching program at EMBL-EBI was used to examine our protein from PDB to find similarities within whole SCOP (Structural Classification OF Proteins) archive. Chloroperoxidase protein structure was used as a comparison due to its significant Z-score and low Rmsd value. PyMol was then used to structurally align both proteins together comparing differences in structure.
Determining Function of Protein
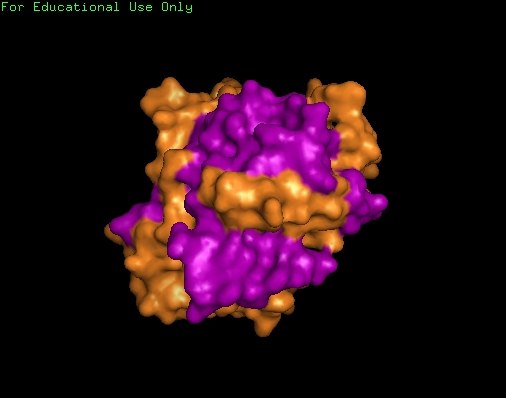
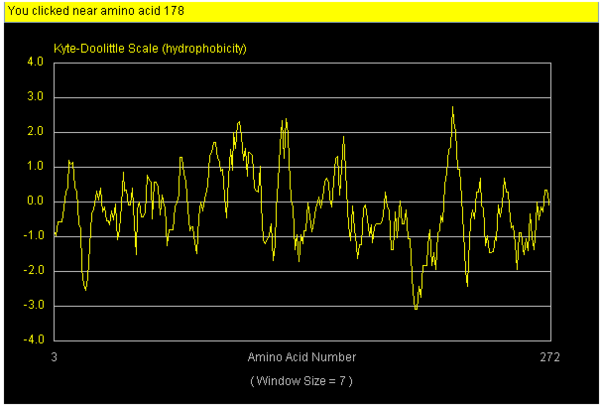
References journals on our protein were found via PUB med. Profunc was use to determine the most likely biochemical function of our protein based on its 3-d structure. Strings database was then used to correlate its interaction with other proteins. Hydropathy plot and hydrophobicity calculator was used to mark specific hydrophobic and hydrophilic region on surface of our protein.
Determining Evolutionary relationship.
Results
