COASY results: Difference between revisions
| Line 116: | Line 116: | ||
===Figure 3=== | ===Figure 3=== | ||
'''CoA Synthase Expression. Reproduced from Genomics Institute of Novartis Research Foundation (2007).''' <BR> | '''CoA Synthase Expression. Reproduced from Genomics Institute of Novartis Research Foundation (2007).''' <BR> | ||
[[Image:CoA synthase localisation.png|framed| | [[Image:CoA synthase localisation.png|framed|Figure 3: <BR> CoA Synthase Expression. Reproduced from Genomics Institute of Novartis Research Foundation (2007).|left]]<BR> | ||
==Domain and Structural Analysis== | ==Domain and Structural Analysis== | ||
Revision as of 15:14, 9 June 2007
Structure of Coenzyme A Synthase
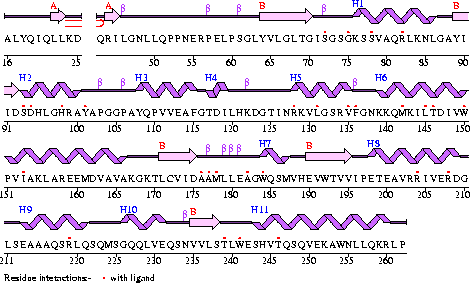
Conezyme A Synthase is structurally composed of seven strands, eleven helices and thirteen beta turns (EMBL EBI, 2005) (see Figure 2). Analysis of structurally related proteins (Holm & Sander, 1993) showed a trend for transferase (RCSB, 2007) class proteins with Rossmann class folds (Rossmann, 1973). The Rossmann topologies of fold’s are an alpha-beta class fold that forms a three or more layer beta strand sandwich alternating with alpha helices (beta-alpha-beta-alpha-beta). PFAM classification placed these into either the Cytidylyltransferase or Dephospho-CoA kinase familes, matching the two domains of Coenzyme A Synthase. Those classified under the Dephospho-CoA kinase type were commonly of the P-loop containing nucleotide triphosphate hydrolases (Sanger Institute, 2005) homology whilst those classified as Cytidylyltransferase were of the Tyrosol-Transfer RNA Synthetase (Sanger Institute, 2005). As the majority of the structurally related proteins identified contained the DPCK domain solely, and the motif for a P-loop (Table 1) was identified in the Conzyme A Synthase sequence (Bairoch, Bucher, & Hofmann, 1997) it is suggested that Coenzyme A Synthase is also of the P-loop containing nucleotide triphosphate hydrolases homology of folds.
Figure 2
Table 1
| Pattern-ID: | GLYCOSAMINOGLYCAN PS00002 PDOC00002 |
| Pattern-DE: | Glycosaminoglycan attachment site |
| Pattern: | SG.G |
| Position: | 84 SGSG |
| Pattern-ID: | PKC_PHOSPHO_SITE PS00005 PDOC00005 |
| Pattern-DE: | Protein kinase C phosphorylation site |
| Pattern: | [ST].[RK] |
| Position: | 3 SDK |
| Position: | 52 SFR |
| Position: | 86 SGK |
| Pattern-ID: | CK2_PHOSPHO_SITE PS00006 PDOC00006 |
| Pattern-DE: | Casein kinase II phosphorylation site |
| Pattern: | [ST].{2}[DE] |
| Position: | 39 SHNE |
| Position: | 251 TLWE |
| Position: | 260 SQVE |
| Pattern-ID: | MYRISTYL PS00008 PDOC00008 |
| Pattern-DE: | N-myristoylation site |
| Pattern: | G[^EDRKHPFYW].{2}[STAGCN][^P] |
| Position: | 82 GISGSG |
| Position: | 222 GLSEAA |
| Pattern-ID: | ATP_GTP_A PS00017 PDOC00017 |
| Pattern-DE: | ATP/GTP-binding site motif A (P-loop) |
| Pattern: | [AG].{4}GK[ST] |
| Position: | 82 GISGSGKS |
| Pattern-ID: | UPF0038 PS01294 PDOC00996 |
| Pattern-DE: | Uncharacterized protein family UPF0038 signature |
| Pattern: | G.[LI].R.{2}L.{4}F.{8}[LIV].{5}P.[LIV] |
| Position: | 136 GTINRKVLGSRVFGNKKQMKILTDIVWPVI |
Localisation Expression of Coenzyme A Synthase
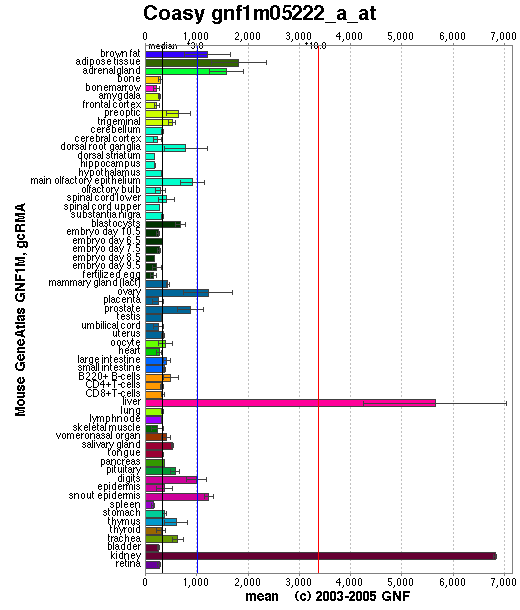
Baseline expression of CoAsy was present in all tissues. Expression was slightly elevated in adipose tissue, and highly elevated in the liver and kidney (See Figure 3). Baseline expression of the other enzymes involved in the CoAsy pathway was also present in all tissues. However, expression of these enzymes was otherwise unlike that of CoA, as they were not particularly elevated in the liver and kidney (data not shown).
Figure 3
CoA Synthase Expression. Reproduced from Genomics Institute of Novartis Research Foundation (2007).
Domain and Structural Analysis
Local sequence alignment showed that CoAsy Chain A residues 13-281 corresponded to residues 295-563 on full length CoAsy. This indicates that a 295 amino acid stretch extending from residues 1 to 295 on the full length protein was cut out during structural analysis and was not present on chain A.
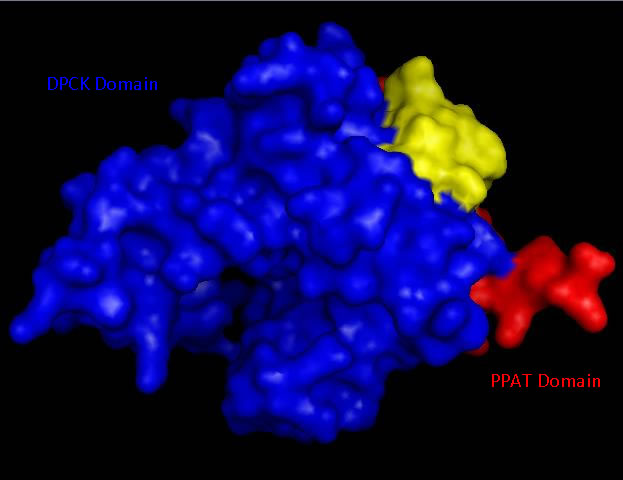
Bioinformatic analysis using NCBI Entrez protein indicated that mouse CoAsy (full length) possess two domains, a PPAT and a DPCK domain. The PPAT domain extended from residues 194-338, and the DPCK domain from residues 359-536. PFAM analysis of CoAsy chain A also indicated the presence of two domains, the DPCK domain from residues 64-242 and a CTP transferase 2 domain (part of the cytidylyltransferase family, of which PPAT is a member) extending from residues 1-44, which corresponds to a fragment of the PPAT domain. The position of these domains on CoAsy chain A is shown in Figure 4. Profunc analysis of CoAsy chain A detected the DPCK domain, but not the fragment of the PPAT domain.
Figure 4
Surface structure of Mus musculus Coenzyme A Synthase with Phosphopantetheine adenylyltransferase (PPAT) and Dephospho-CoA kinase (DPCK) domains marked in red and blue respectfully.
Structural Elements and Functional Binding Sites of Coenzyme A Synthase
Figure 5
Surface map of Mus musculus Coenzyme A Synthase with electrostatic charge indicated, ATP ligand is included at P-Loop bind site of DPCK domain and ACO at the proposed Dephospho Coenzyme E Kinase cleft.
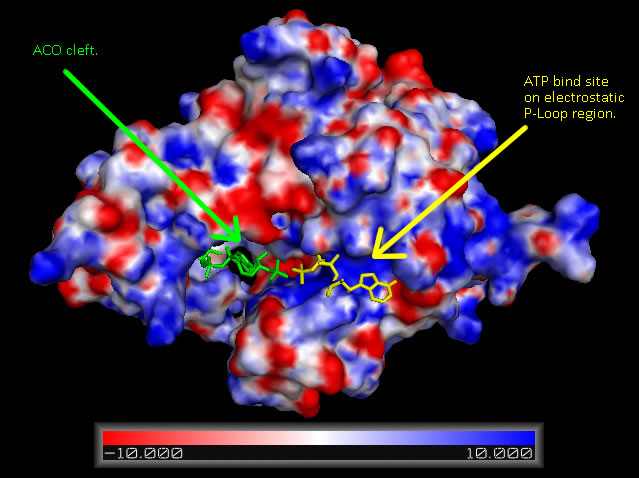
Figure 6
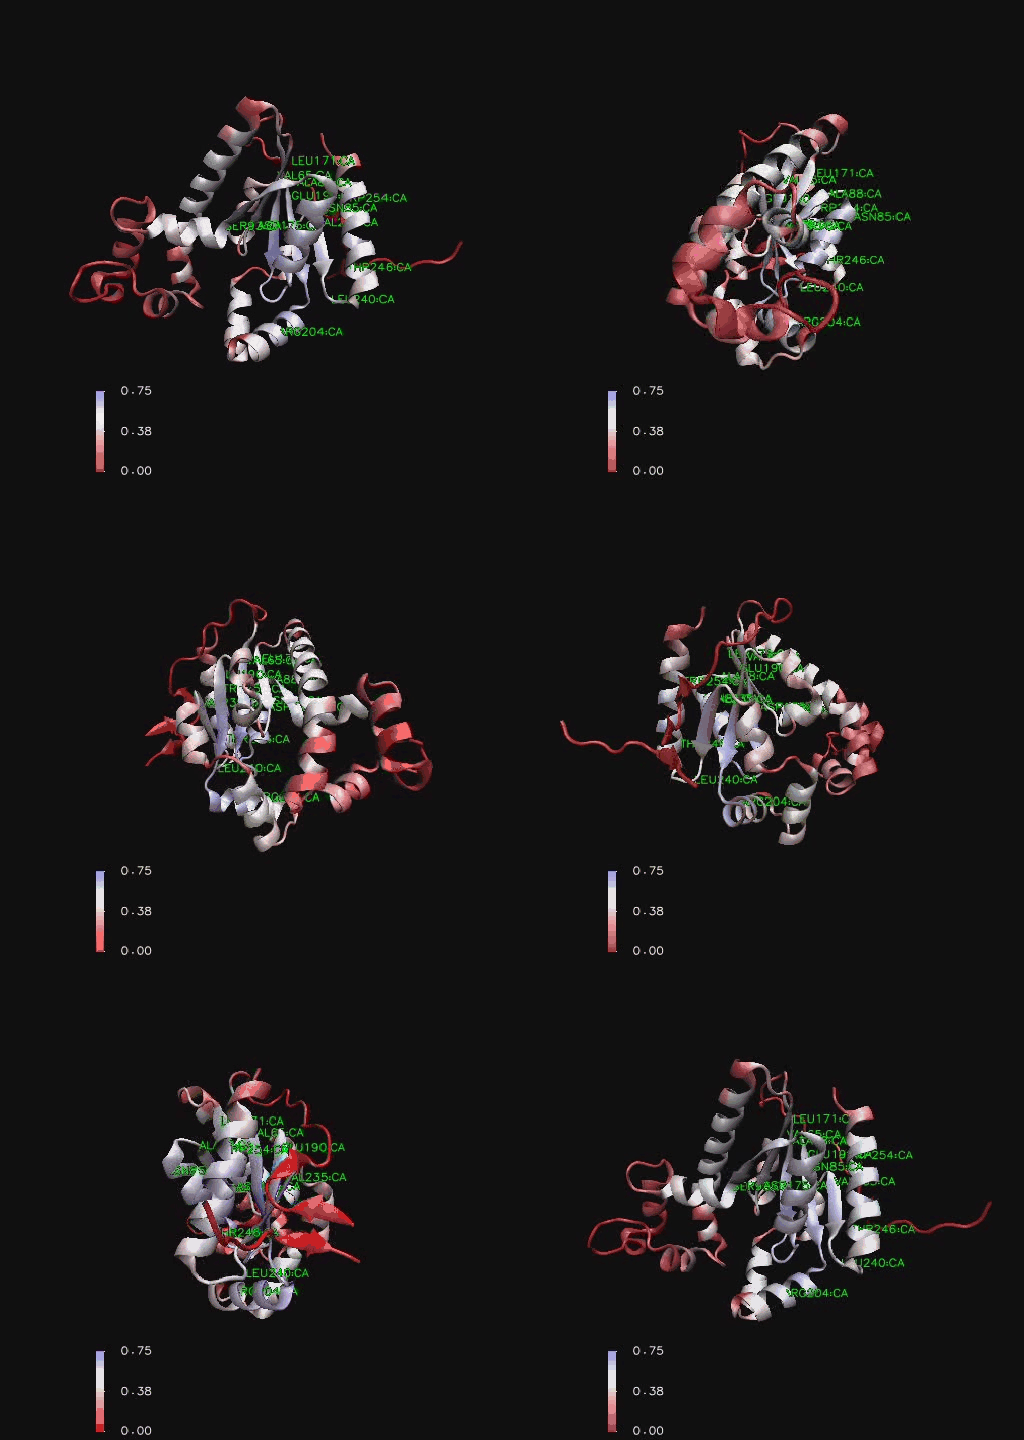
Ribbon representation of Mus musculus Coenzyme A Synthase (RCSB, 2007) with conservation of structural features marked for structurally related proteins. Note P-Loop conservation (residues 65-85).
Abstract | Introduction | Results | Discussion | Conclusion | Method | References
