Fascin Results
BLAST
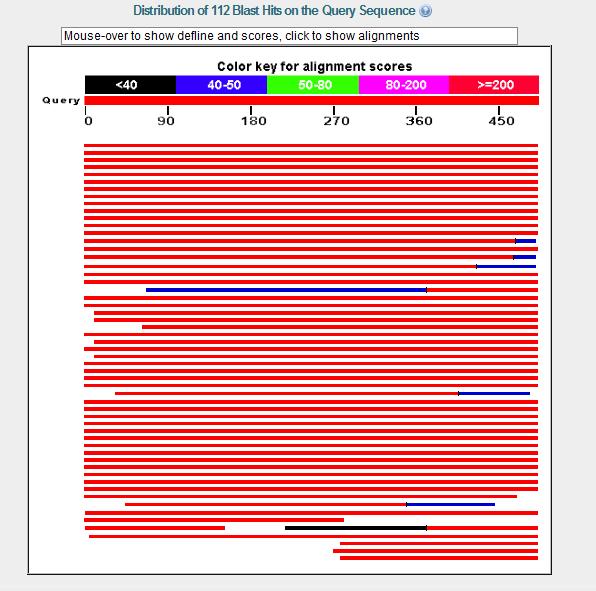
Blast Results show that fascin 1 is very highly conserved throughout the Eukarya Domain providing 112 hits all with excellent E value and High scores
Sample Fascin sequence (Text File)
FASTA sequences from BLAST (Text File)
Multiple Alignment
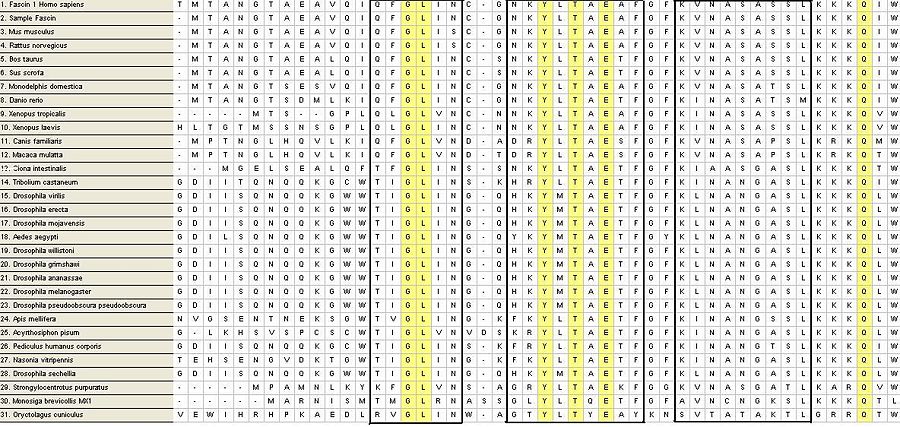
From a possible 100 FASTA sequences, were cut down to 31. The process of elimination was conducted by the deletion of sequences with too many bp before and after the sample sequence, followed by the deletion of sequences with large segments of gaps in conserved and variable regions of the sequence alignment. Fascin domains were found via a protDOM search and compared to the remaining sequences.
Phylogeny Trees
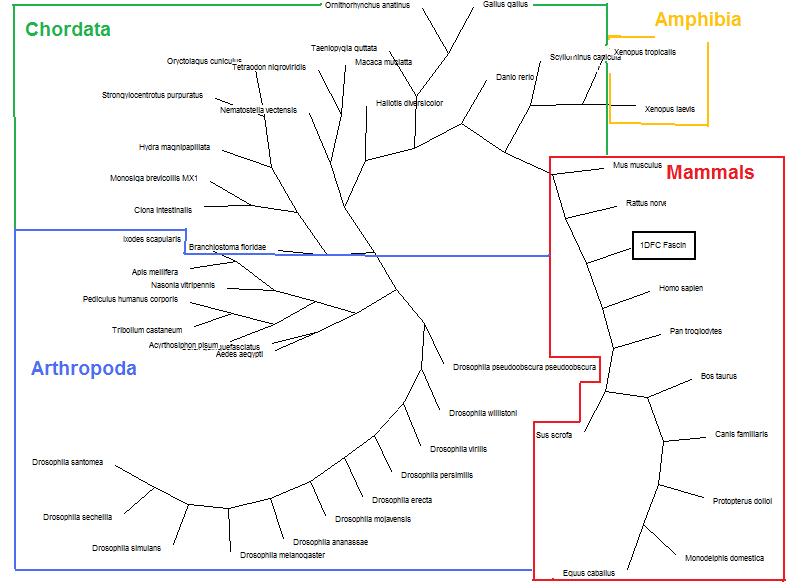
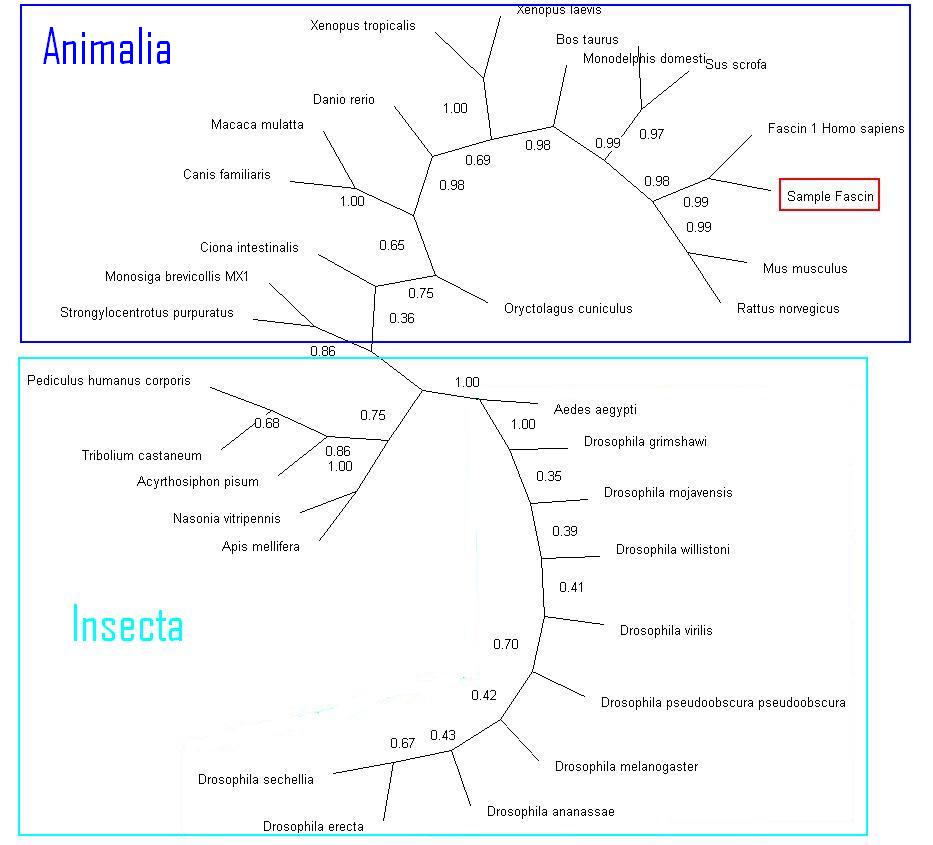
Before any deletion of sequences occured, A tree was formed using 100-replications Dayhoff neighbor-joining method as a base line.
Neighbor-method with Bootstrap values (1 = 100) Results were run at 500 replications
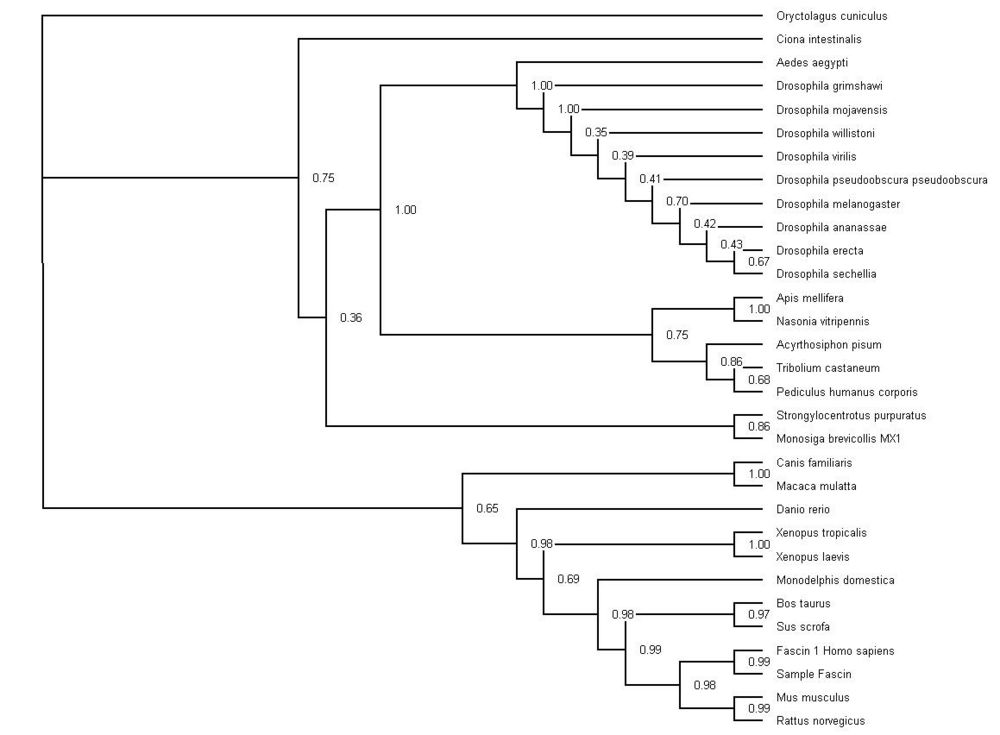
Neighbor-method with Bootstrap values, compressed. Sequences with below 50 were deleted.
Fascin structure and domains
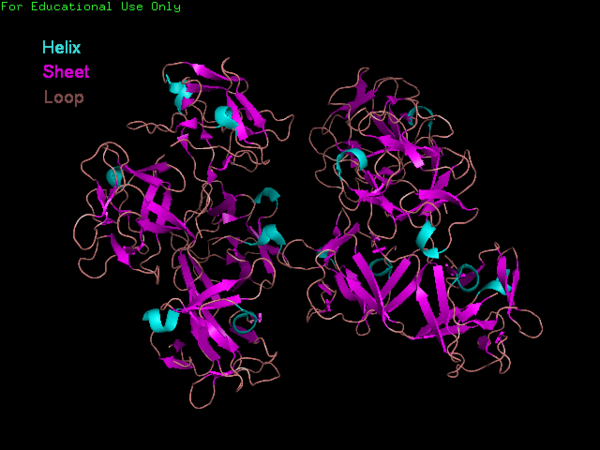
The Fascin protein is comprised of 8 repeats of the Fascin-like domain in total. It is made of two identical subgroups, each of which contains 4 Fascin-like domains linked together. The 2 subgroups are linked back to back slightly off-centre. The Fascin-like domain's tertiary structure adopts a beta-trefoil fold pattern with an internal threefold repeat. Secondary structure is predominantly Beta-sheet and random coil (loop) with small regions of alpha-helix. Structural similarity with several unrelated proteins is evident (eg. FGF).
Structual allignments
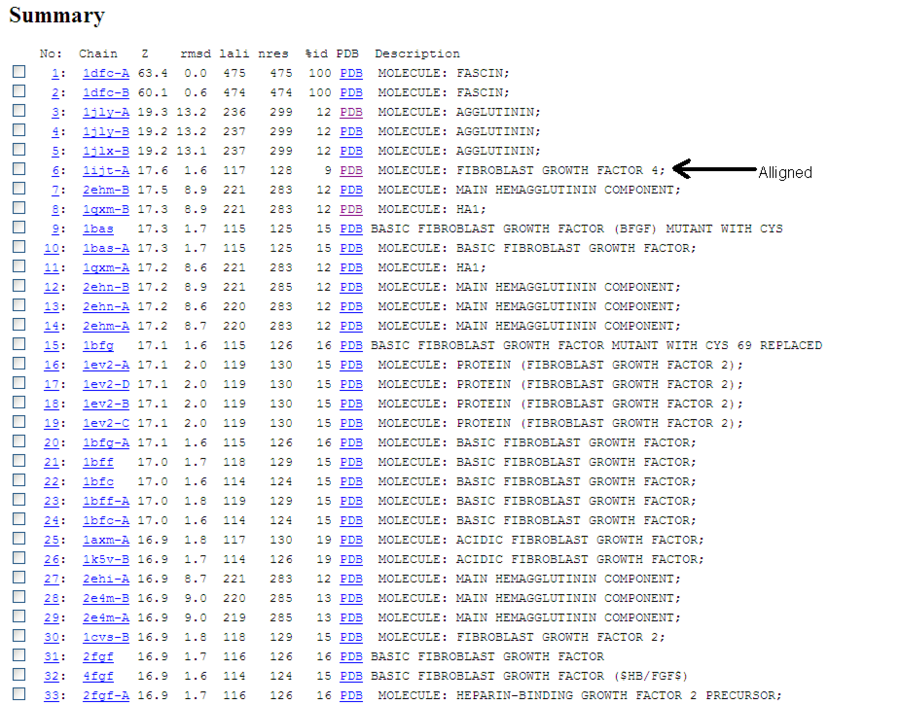
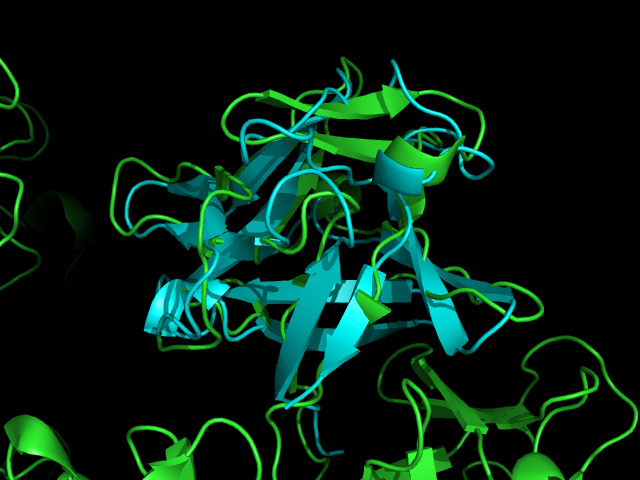
A Dali database search returned several hundred similar structures to Fascin 1. The first page of results can be seen below. Unfortunately none of the structurally similar molecules were actin binding so could not help with actin binding regions. The molecule 1ijt (Fibroblast Growth Factor - FGF) was alligned with Fascin to show structural similarity (even though they are functionally very different and only contain 9% sequence identity). Structurally FGF has much more Beta sheet secondarty structure, but as said before they are still quite similar.
Similarity is between FGF and the Fascin domain (not the molecule).
Cleft/Pocket analysis
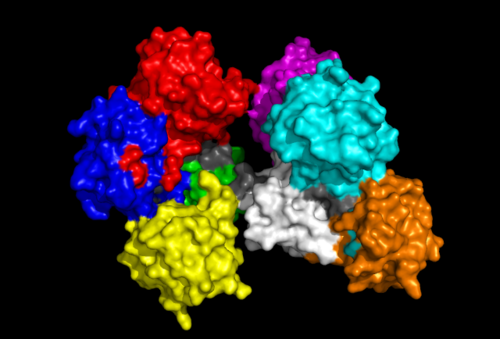
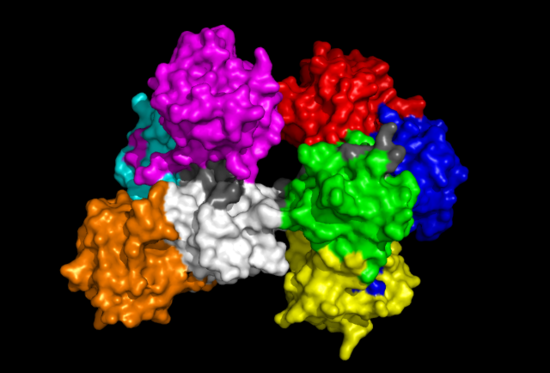
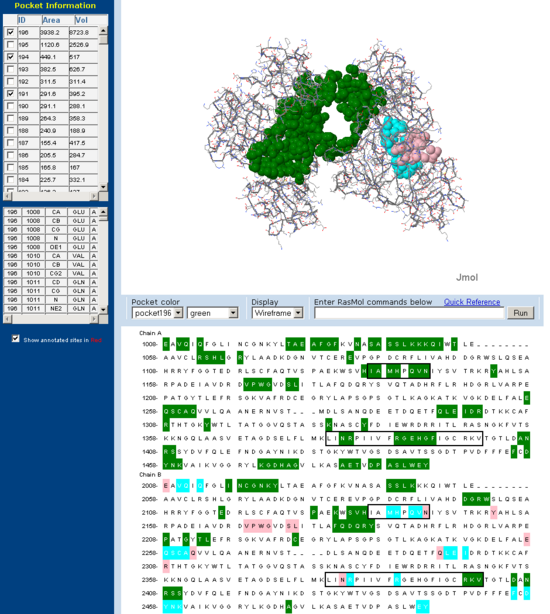
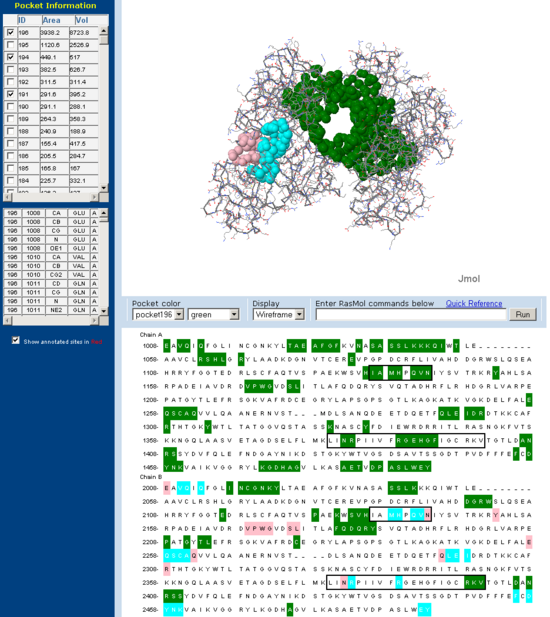
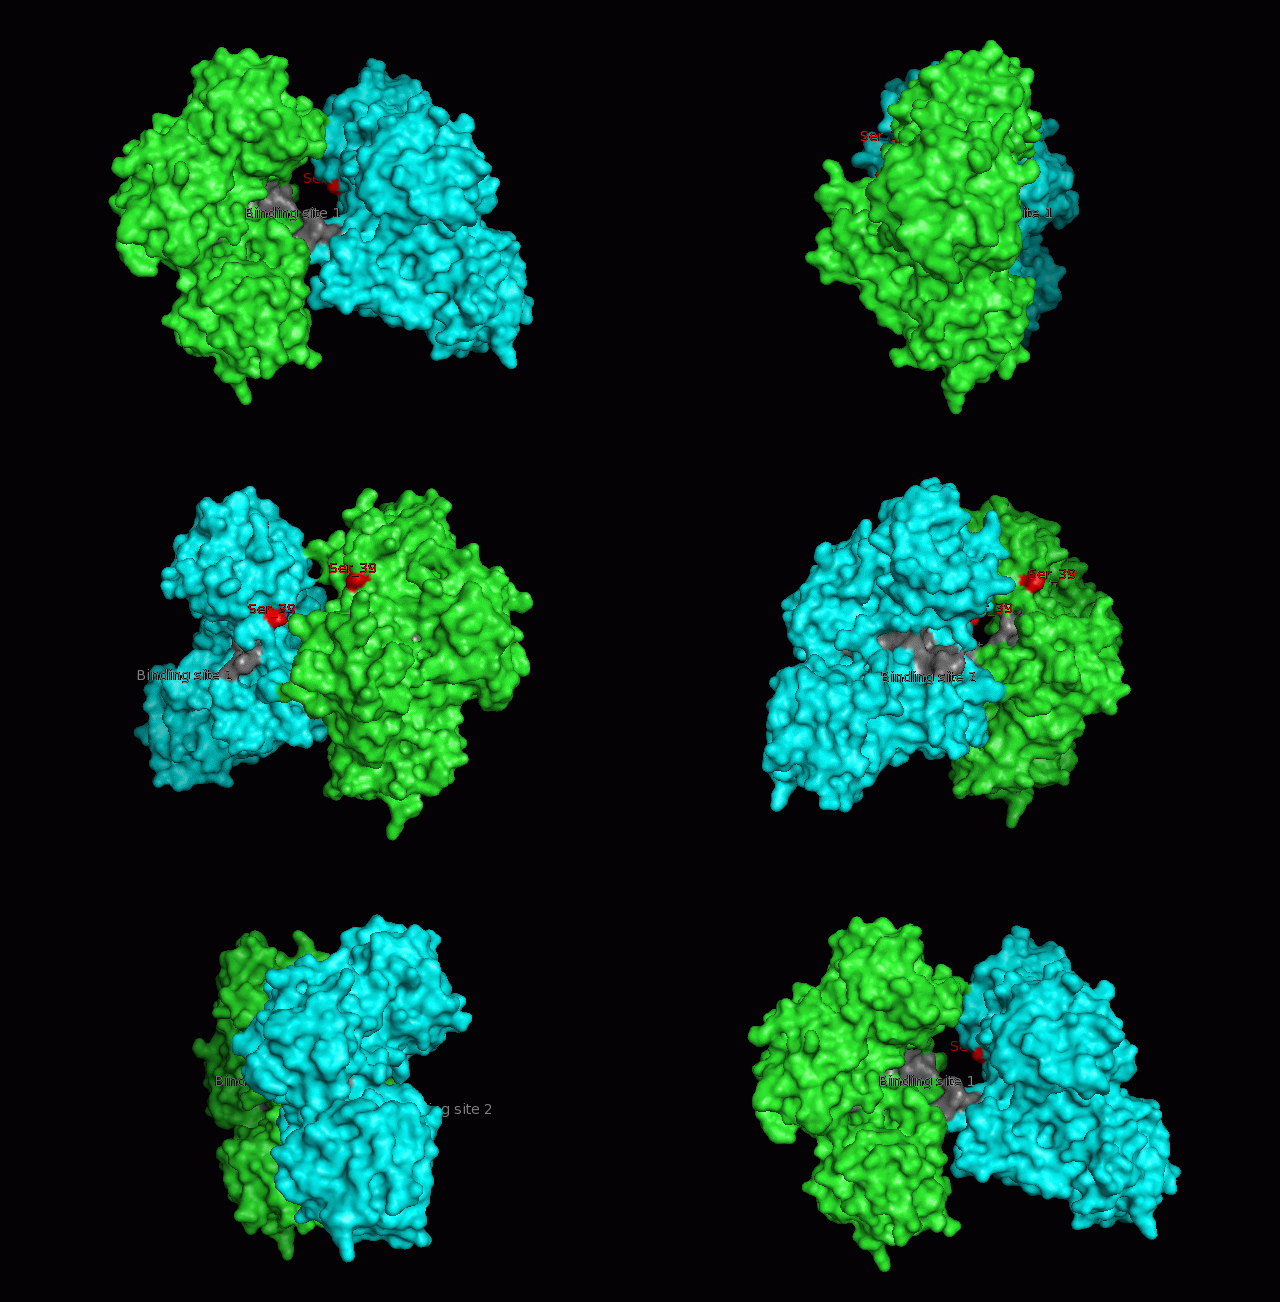
Pockets and clefts in the molecular surface of Fascin were analysed using the online service CASTp (Dundas J et. al. 2006). Three major pockets corresponding to the beleived actin binding sites for Fascin are shown with both a front and back view. Conserved regions from 'across species' multiple sequence allignment are outlined in the sequence window. Note how many of the residues involved in the pocket are from these conserved regions.
Electrostatic surface model
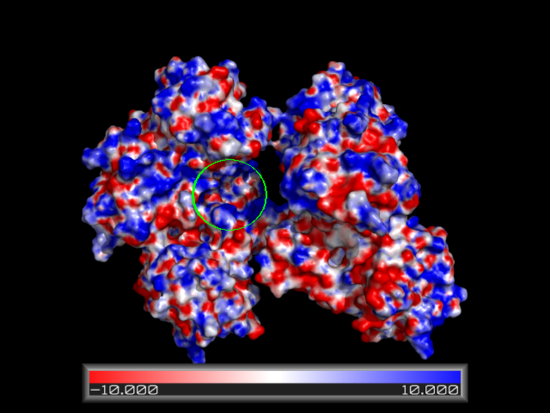
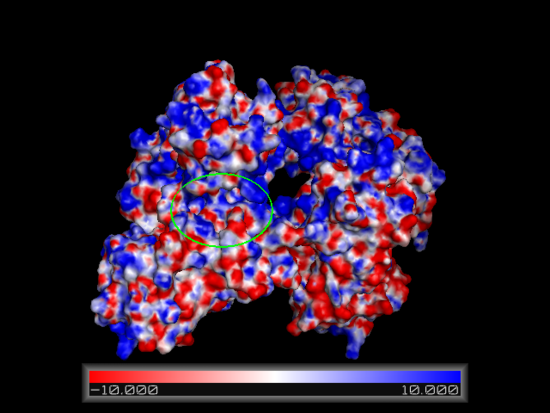
Using the online PDB2PQR resource in conjunction with the APBS feature in pymol an electrostatic surface model for Fascin was generated. Regions corresponding to our putative actin binding sites were circled. Note the positively charged regions encapsulating a negatively charged centre.
Hydrophobicity Plot
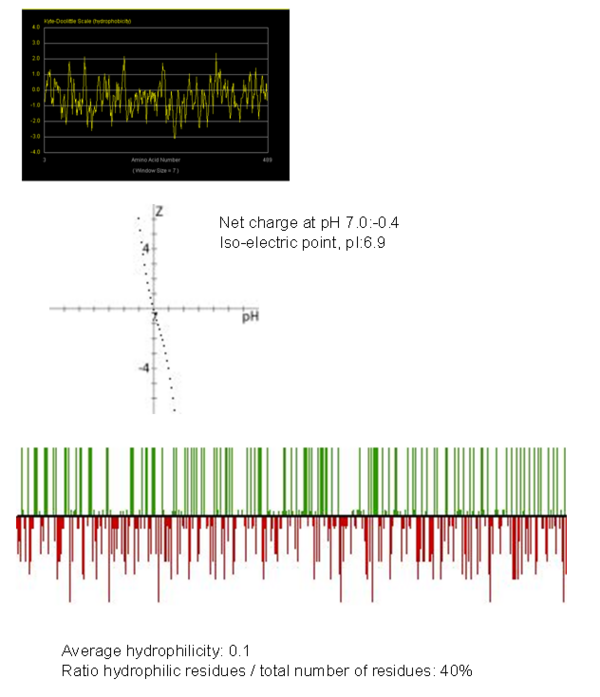
A hydrophobicity plot was generated and showed that overall the Fascin-1 protein is hydrophobic.
Important molecular regions
The focus so far has been on binding of Fascin to its ligand actin. Fascin actually interacts with many other protein molecules to undergo its function. One such molecule is the phosphorylating molecule phosphokinase-C (PKC). Phosphorylation of serine residues 39 on a Fascin subgroup alters the actin binding properties of the molecule. From our research we have also found that although it is known Fascin binds actin, the site of binding is still unknown. Through multiple sequence allignment across species, electrostatic modeling and pocket analysis we have tried to determine the actin binding site on the Fascin molecule. The image below shows Fascin's overall composition and these 2 important regions.
Putative actin binding sites were localised to residues 136-143 and 386-395.
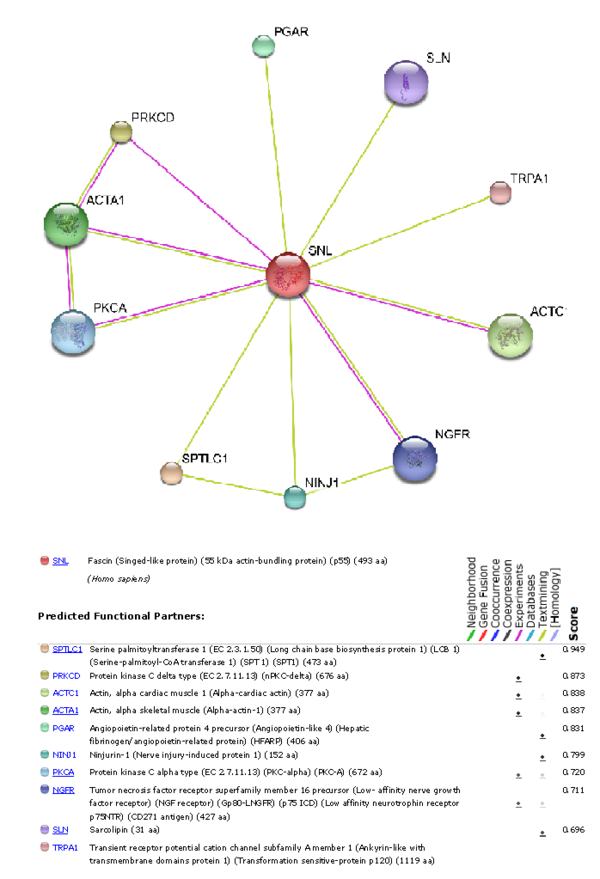
Protein Interaction and Cellular Location
Interaction of other proteins with Fascin-1 and its concentrations levels in different regions of the body were analysed and represented below.
Abstract | Introduction | Methods | Results | Discussion | Conclusion | References
Back to main page
