Phytanoyl-CoA results
Abstract | Introduction | Results | Discussion | Conclusion | Method | References
Sequence Analysis
Multiple Sequence Alignment
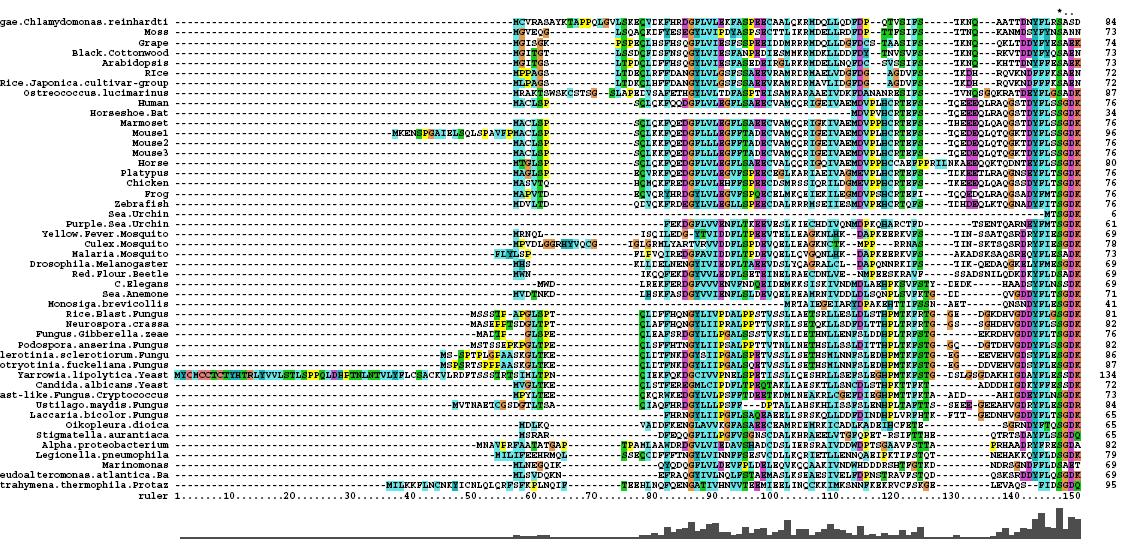
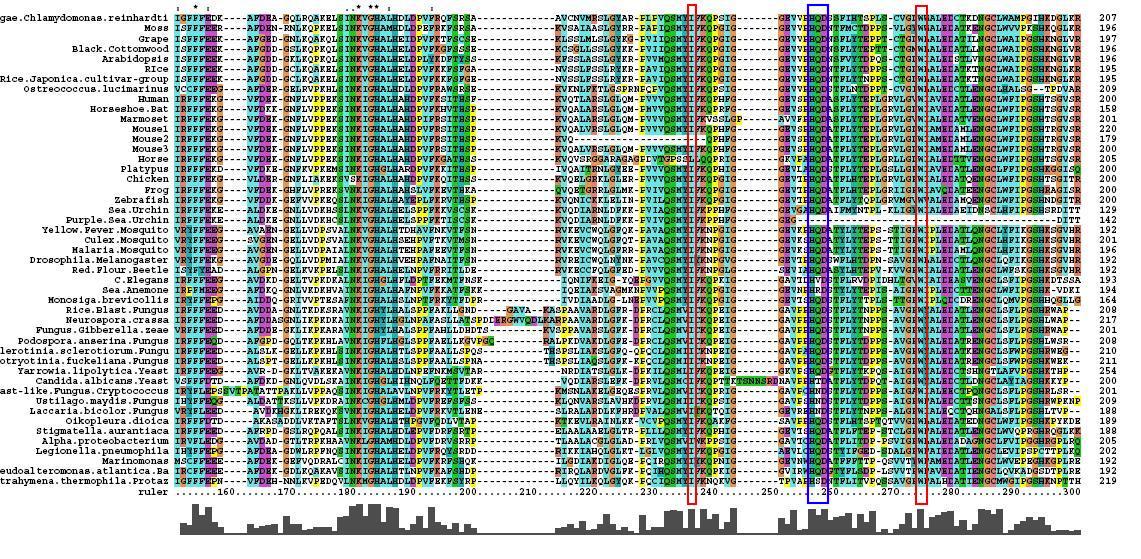
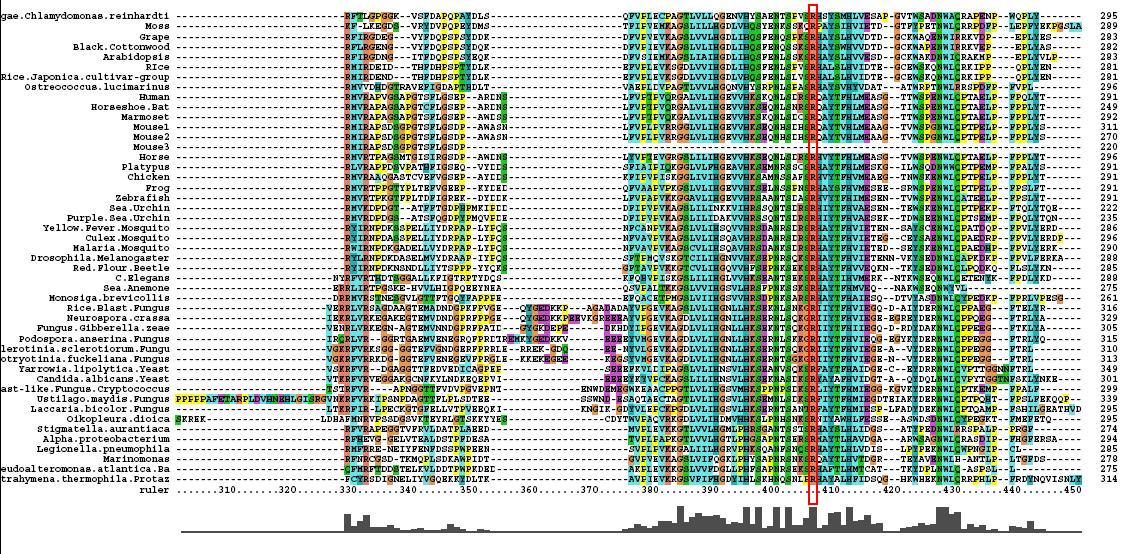
After conducting a BLAST search of the non-redundant databases, 46 analogous sequences were selected for comparison. A multiple sequence alignment was then performed on the sequences. The returned alignment was of an excellent quality with several section of high conservation being identified. The gene appears to be fairly well conserved across all species although the best similarity occurs with other mammalian species. This indicates that the protein is most likely to still have its functionality in most of these species which is remarkable given the broad range of both prokaryotes and eukaryotes investigated. In total there 5 residues conserved across all sequences but several more section of very high similarity. These include the iron binding sites (shown in red) and the 2-oxoglyterate binding site (shown in blue) as highlighted in Figure 1.
Phylogenetic Trees
Data obtained from the multiple sequence alignment could then be utilised to obtain a phylogenetic tree of the sequences and give an understanding of the evolutionary path of PhyD gene. After initial construction of the tree, it is easily apparent that the mammals are the most evolutionary and contain the most closely related form of the PhyD gene. This is followed by fungi which are the grouped together on the next branch of the tree. Bacteria is group further away again and lastly plants appear to be quite distantly removed from the original human gene. The two protozoans in the tree are grouped separately, one with fungi and one with bacteria, whilst the two algae are also grouped as outliers.
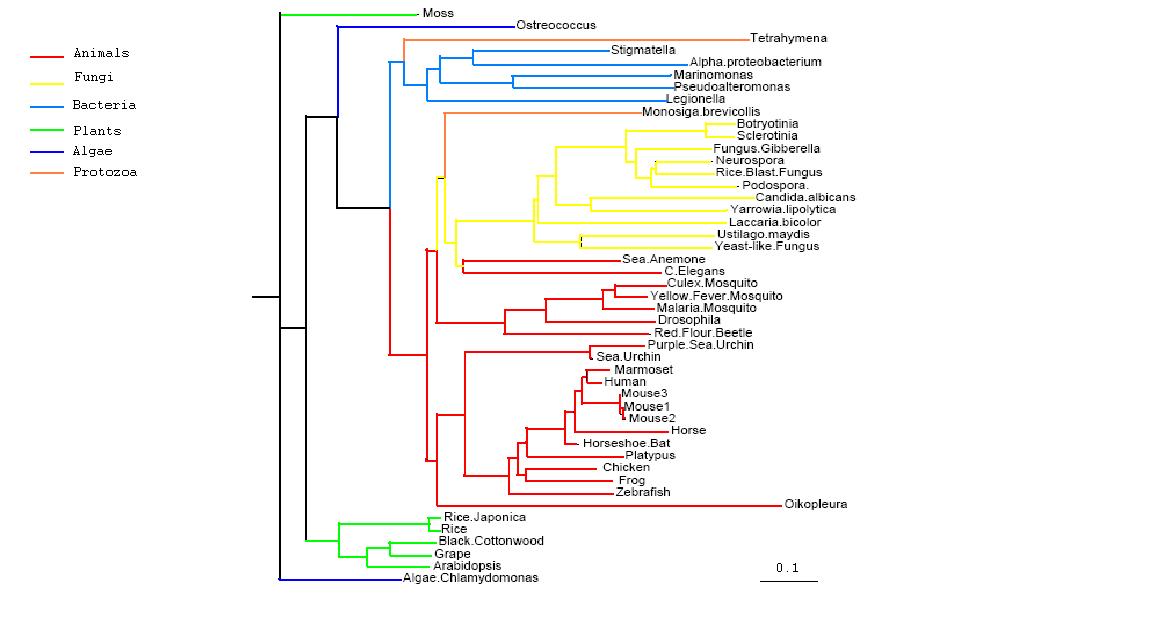
Rooted Phylogenetic Tree obtained from Phylip
Drawn using Phylodendron
http://iubio.bio.indiana.edu/treeapp/
After the tree was bootstrapped a final consensus tree was obtained which is not greatly removed from the original tree, giving added confidence in the groupings. The two protozoans have been again grouped differently, now both with the mammals however their low bootstrap values indicate that this is not a highly supported grouping. In general comparison to taxonomic grouping, our tree groups eukaryote mammals close to fungi but bacteria are also closely associated to them whilst plants are not. This seems to indicate that the function of PhyD is required most by animals and fungi whilst high conservation of the gene is less important in plants.
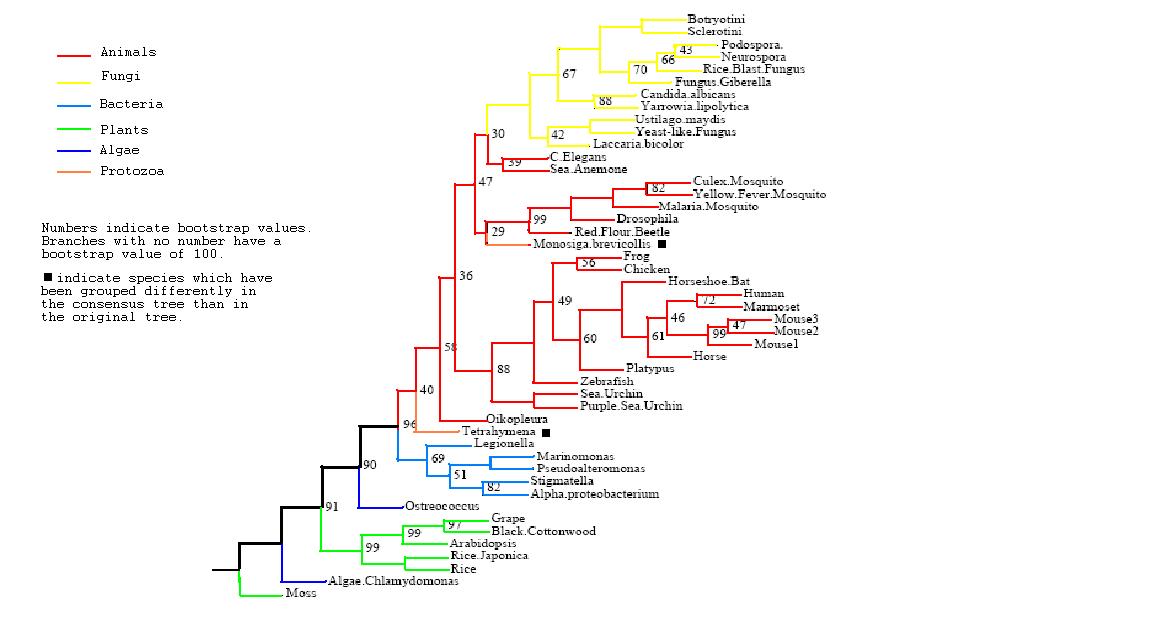
Rooted Consensus Tree with bootstrap values obtained from Phylip
Drawn using Phylodendron
http://iubio.bio.indiana.edu/treeapp/
Structural Analysis
Crystallography Method
The structure of our protein was experimentally defined via X-ray diffraction (by Zhang, Z., Butler, D., McDonough, M.A et.al.). The conditions are as follows -
Method VAPOR DIFFUSION, HANGING DROP
pH 7.0
Temperature 293.0
The results of the crystallography were as follows (from http://www.rcsb.org/pdb/explore/materialsAndMethods.do?structureId=2opw)-
Name - Phytanoyl-CoA dioxygenase (PHYHD1)
Classification - Oxidoreductase, PhyH is a peroxisomal enzyme catalysing the first step of phytanic acid alpha-oxidation (Sanger Institute)
Resolution (Amstrongs) - 1.90
R-Value - 0.221 (obs, relatively low)
Space Group - P 3.1 2 1
Unit Cell Paramters (Amstrongs) - a = 91.97, b = 91.97, c = 81.61
Unit Cell Angles - alpha = 90.00, beta = 90.00, gamma = 120.00
Pymol Visualizations
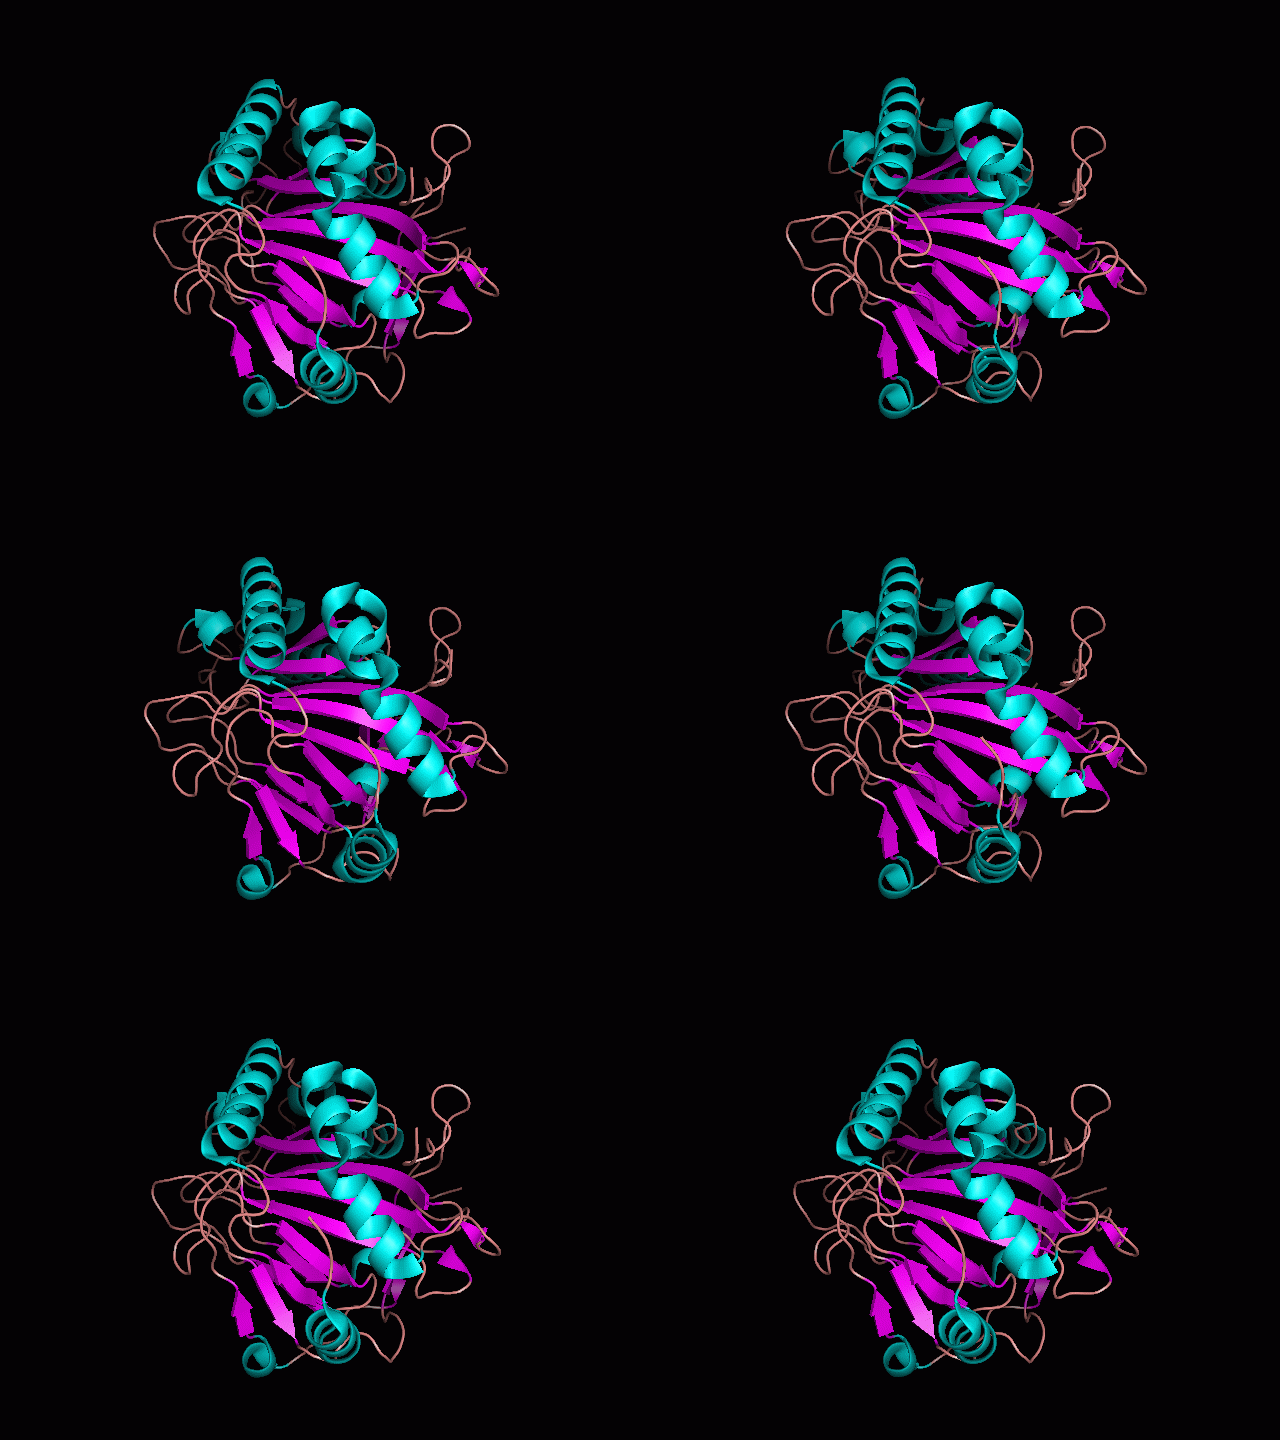
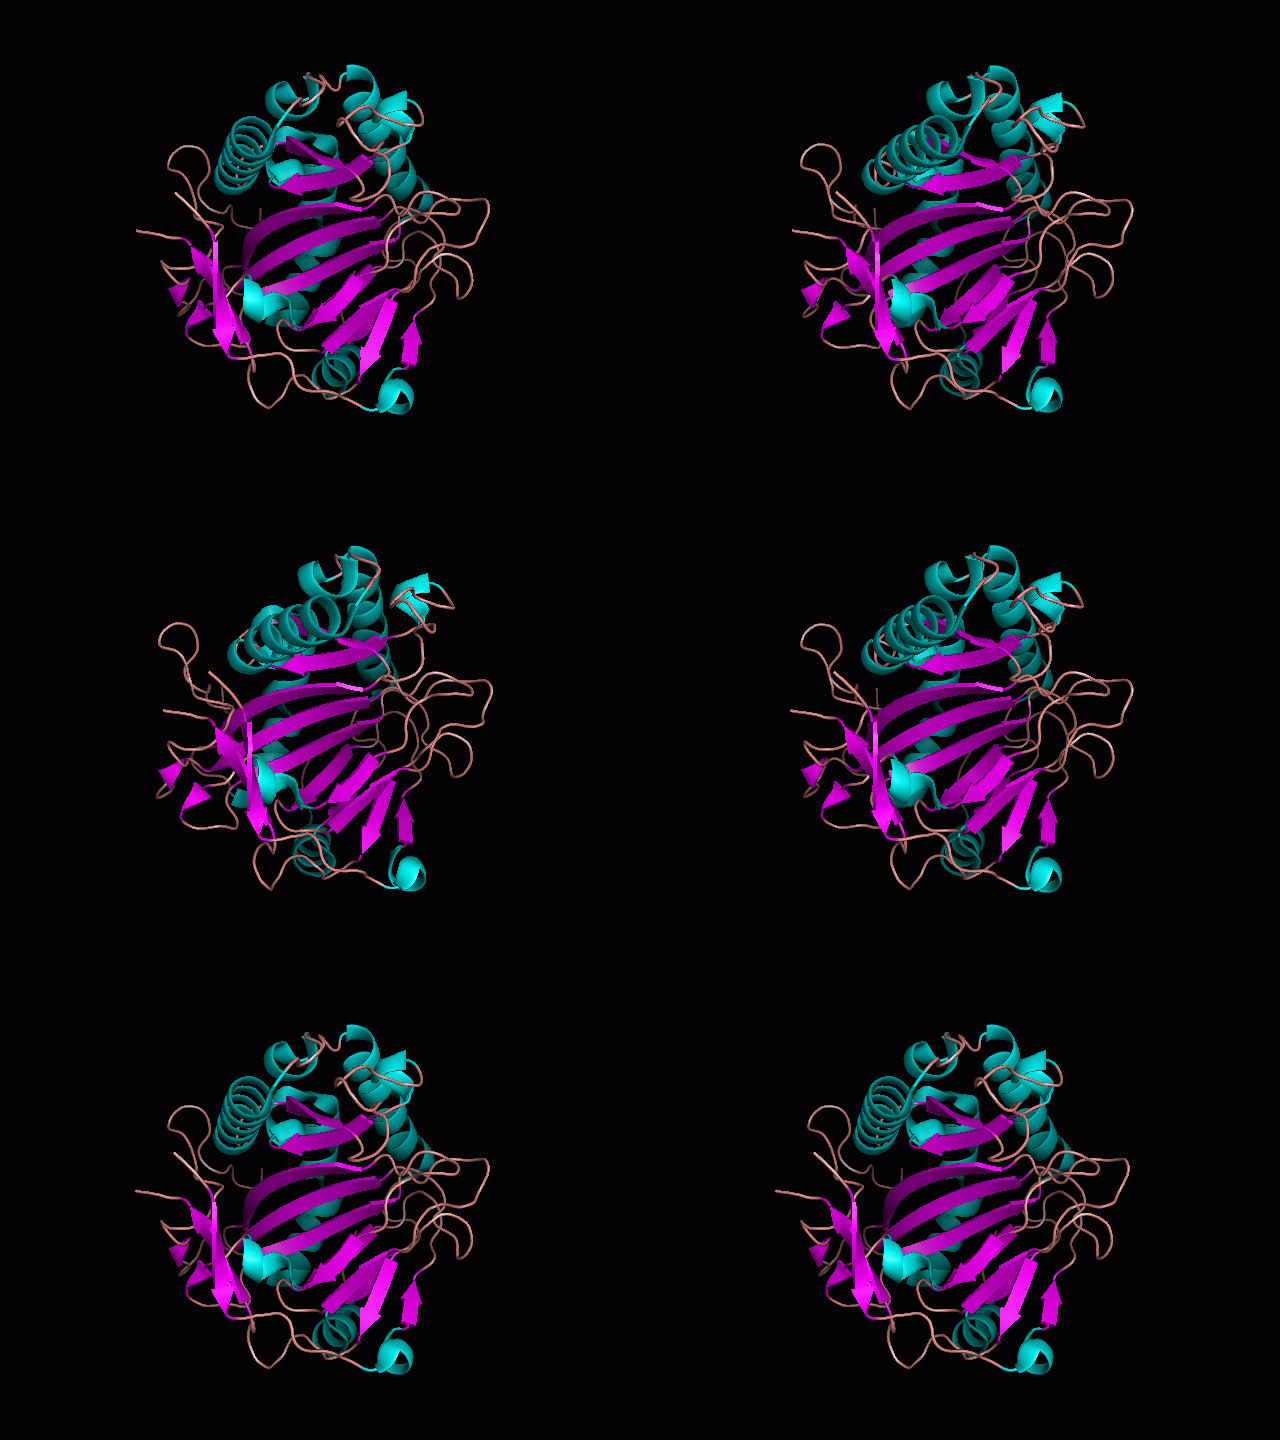
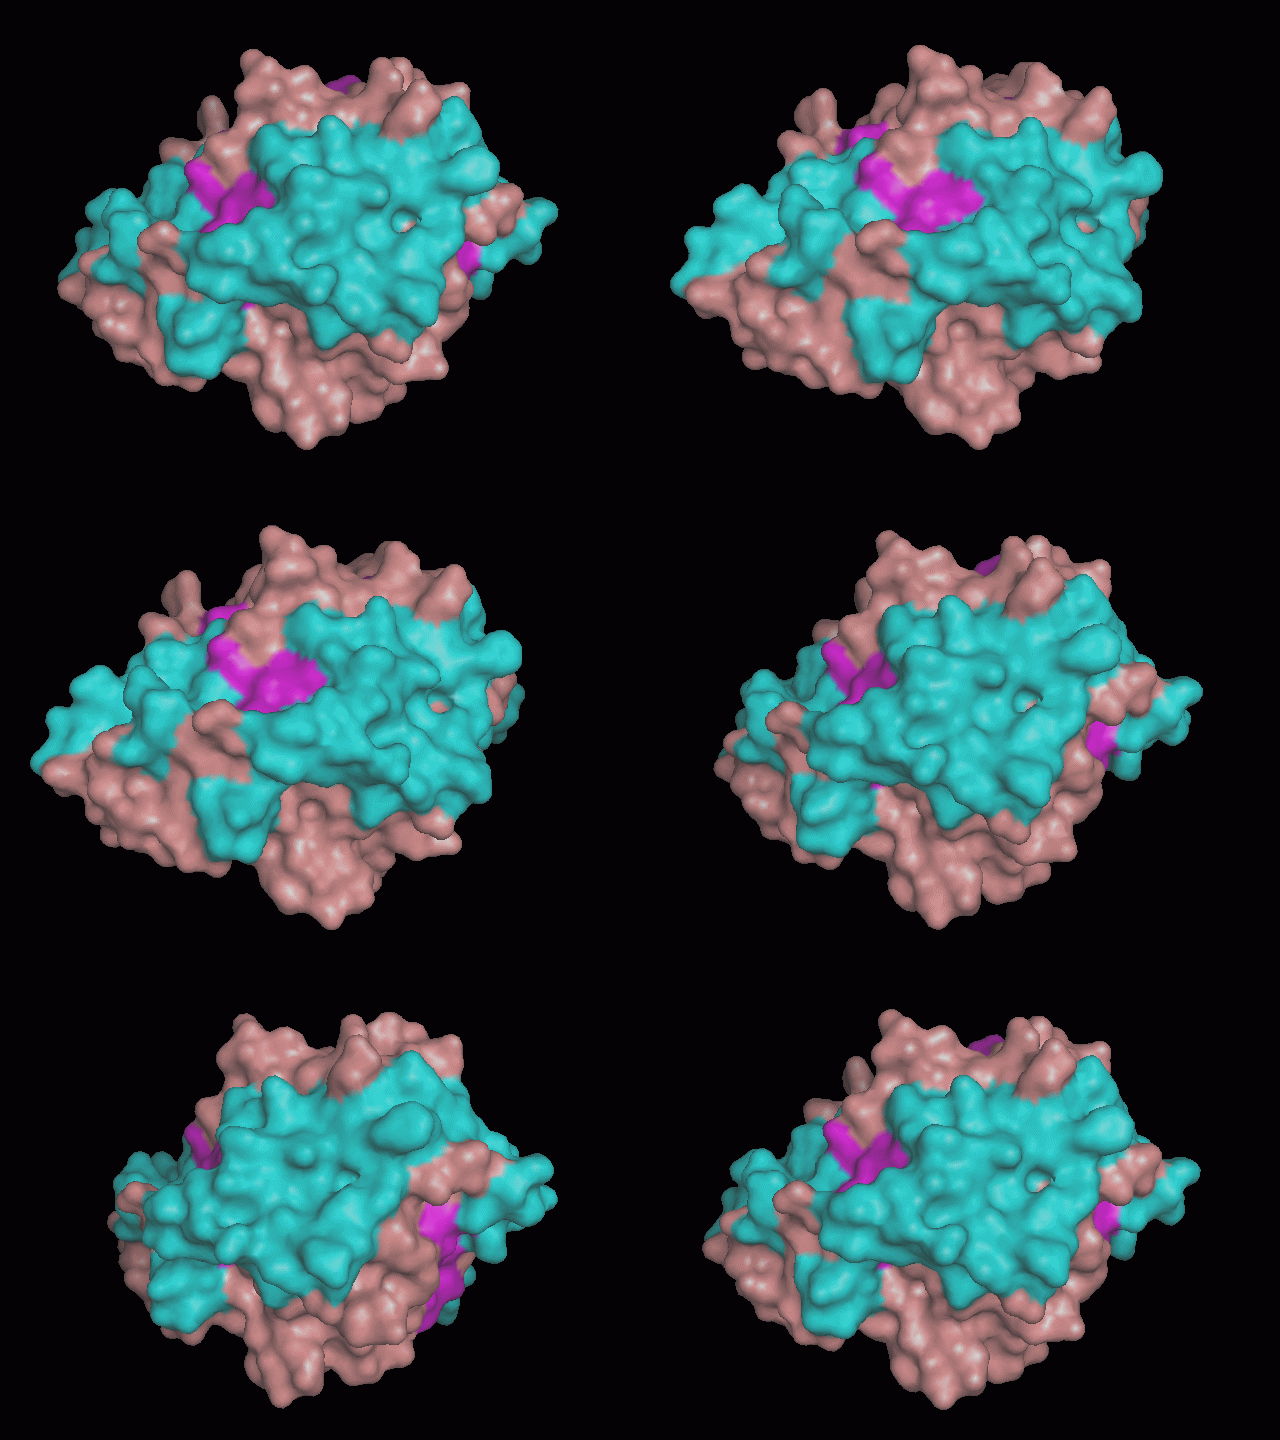
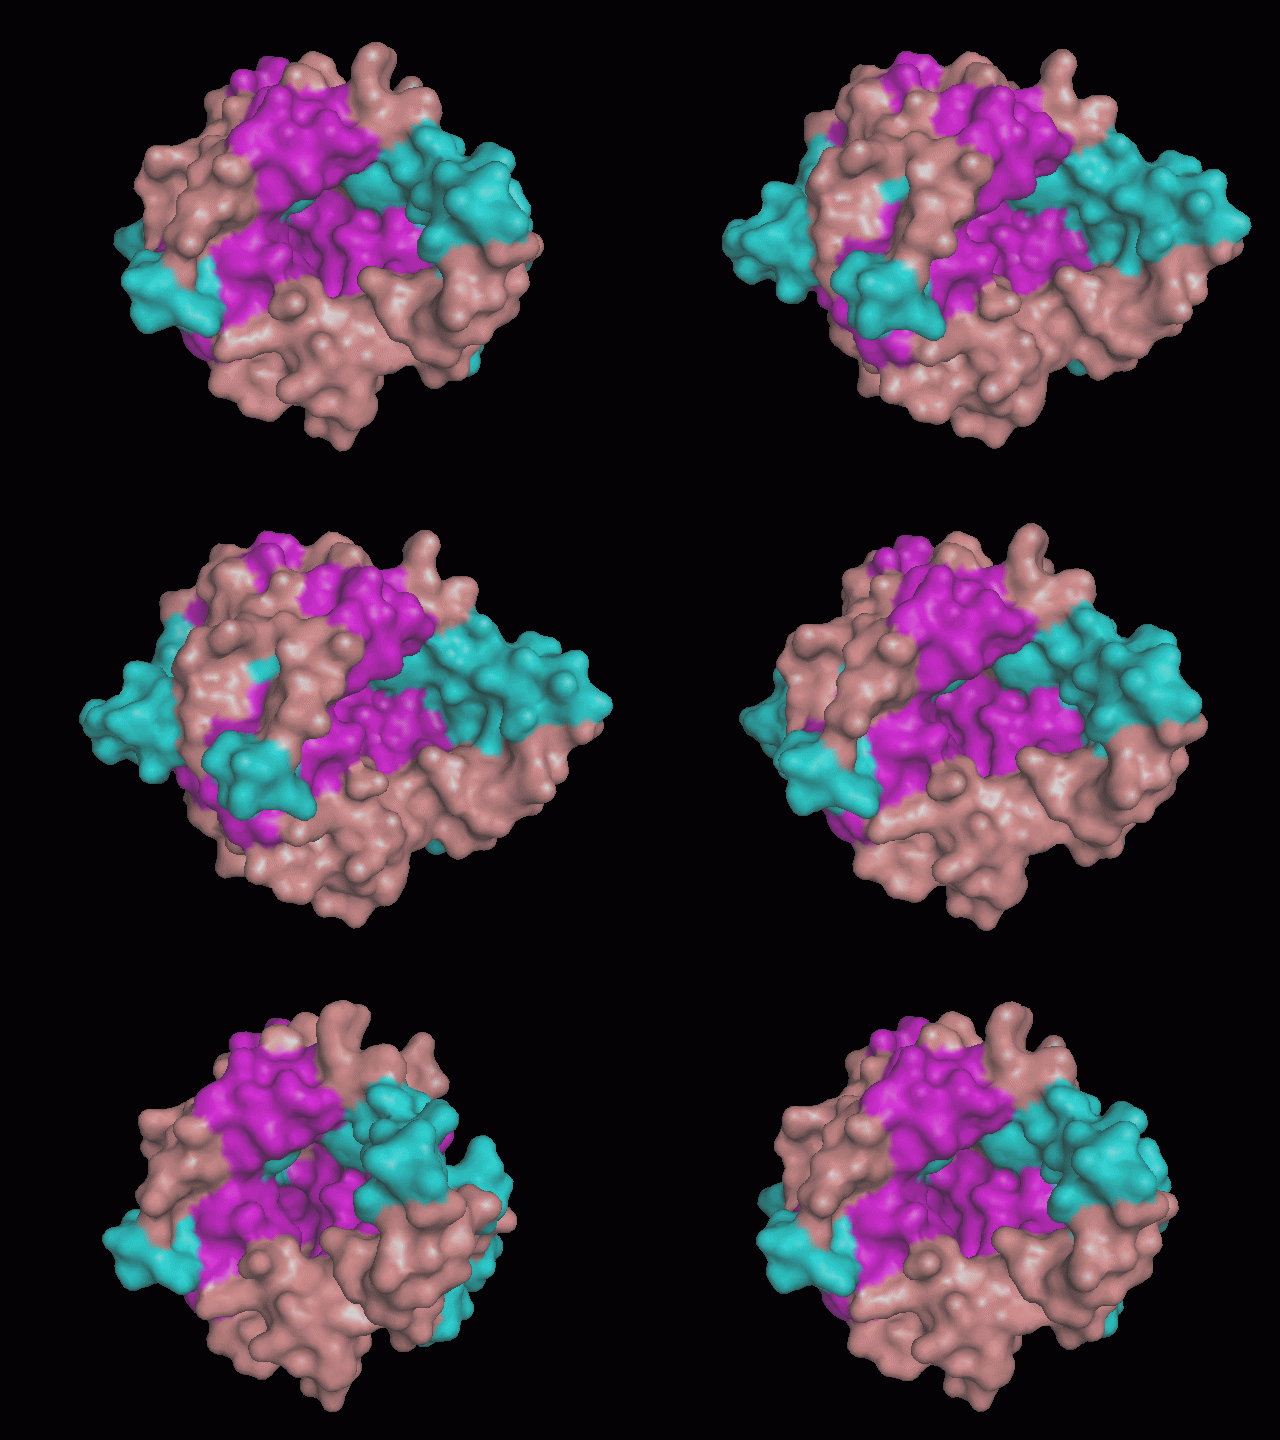
Using Pymol the image was visualized to get a general overview of the protein. These are below. In all visualizations the beta sheets pink, the alpha helices are green and the loops are grey.
There is a large hole in the structure of our protein (figure 2.2, figure 2.4). As steric hinderance is low and the surface area is maximized at this position, it would seem that this area should encompass the binding sites of our protein, or at least be the location of some form of interaction. The fact such a definitive hole in the structure of the protein exists lead us to investigate further properties around this region. Liam will go into more details as to the function of the binding sites and a comparison to a similar protein in his section.
There are high levels of steric hinderance if the approaching ligand comes from behind the molecule (figure 2.1, figure 2.3).
Topology
Promotif returned the following list of structural features.
4 Sheets
3 beta-hairpins
4 beta bulges
15 strands
10 helices
6 helix-helix interactions
24 beta turns
1 gamma turn
It should be noted that a large proportion of the alpha helices are located on the outside of the protein, while the core is mostly composed of beta sheets. The main beta sheet is composed of 7 strands, this makes up most of the protein core. These structural characteristics are further shown in the topology maps ( figures 2.5 and 2.6) below.
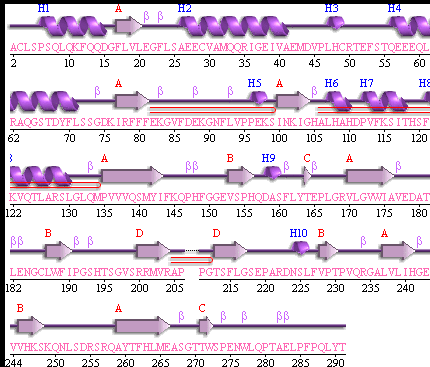
Showing the topology of the protein. Reproduced from the European Bioinformatics Institute.
http://www.ebi.ac.uk/thornton-srv/databases/pdbsum/2opw/domA01.gif
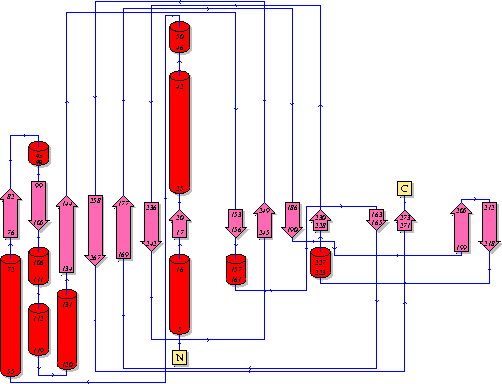
Showing another topology of the protein. Reproduced from the European Bioinformatics Institute.
http://www.ebi.ac.uk/
Variants
The protein itself is found in humans on Chromosome 9, Location 9q34.11. This is shown below.

Showing the location of the gene on the human genome. Chromosome 9, Location 9q34.11. Entrez Gene - http://www.ncbi.nlm.nih.gov/sites/entrez?Db=gene&Cmd=ShowDetailView&TermToSearch=254295#refseq
The protein itself is one of three different isoforms (a,b and c).

Showing the differences in translation between the 3 isoforms. Entrez Gene - http://www.ncbi.nlm.nih.gov/sites/entrez?Db=gene&Cmd=ShowDetailView&TermToSearch=254295#refseq
Isoform a - the longest transcript
Isoform b - this variant lacks a coding exon causing a frameshift. The resulting protein has a longer, more distinct C-terminus than isoform a.
Isoform c - this variant lacks an in-frame coding exon present in isoform a.
SCOP & Dali
A search of SCOP was made using Secondary Structure Matching (SSM). The results showed a similar protein, 2a1x, Human Phytanoyl-CoA 2-Hydroxylase In Complex With Iron AND 2-Oxogluturate. This showed only 20% sequence alignment, however, 70% of the secondary sequence elements align. This similar protein was investigated by Liam and will be discussed further in his section of the report. The actual results of the search are given below.
A search of Dali provided the same hit on 2a1x. The results were the same as SCOP as expected.
Function Analysis
Interpro analysis showed motif similarity to the family of phytanoyl-CoA hydroxylases (PhyH) (Figure 3.1) and Secondary Structure analysis via profunc showed high structural identity to phytanoyl-CoA hydroxylase (PDB code; 2a1x) (Figure 3.2). Although the sequence homology between Phytanoyl-CoA dioxygense and the hydroxylase identified was only 24.9%, a pymol analysis showed the two enzymes to have a high structural similarity.
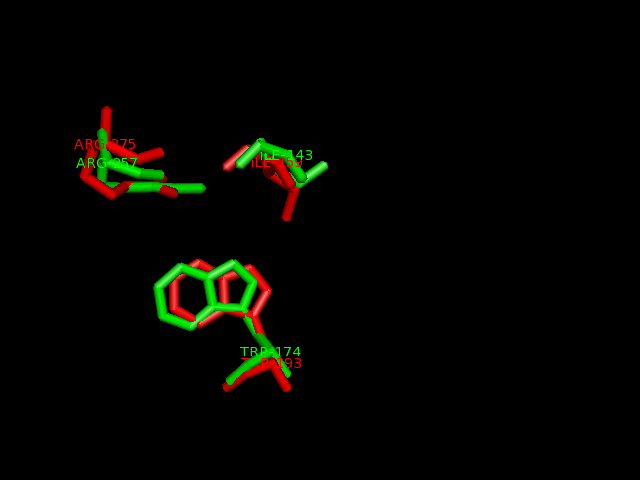
Pymol analysis of similarity between Phytanoyl-CoA dioxygenase and Phytanoyl-CoA hydroxylase
Fe2+ binding sites
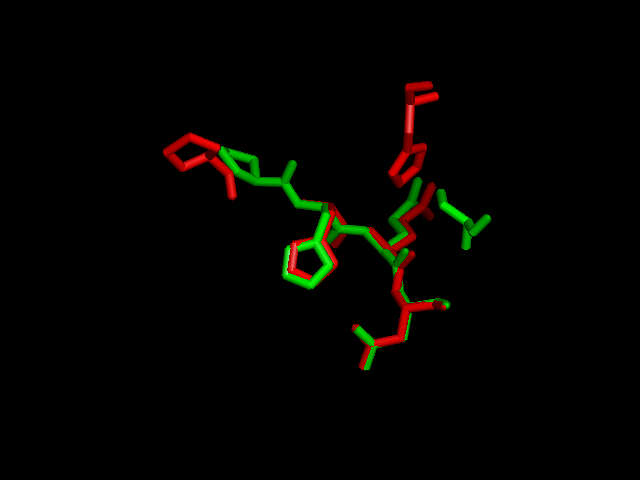
A putative iron binding site was identified in phytanoyl-CoA dioxygenase by structural comparison to the iron binding site of phytanoyl-CoA hydroxylase. Residues PRO155, HIS156, GLN157 and ASP158 show structural similarity to the PRO173, HIS175, GLN176 and ASP177 of the hydroxylase enzyme. HIS220 is also involved in iron binding in the hyroxylase but no histadine residue exist in this position in the dioxygenase. It is hypothesised that the histadine binding is replaced by a serine at position 160, which is spacially close to the histadine in the pymol alignment.
2-oxogluatarate binding site
Ligand binding template results from profunc matched TRP193, ILE159 and ARG275 from hydroxylase with the TRP174, ILE143 and ARG257from the dioxygenase (e-value 1.95x10⁻⁸).
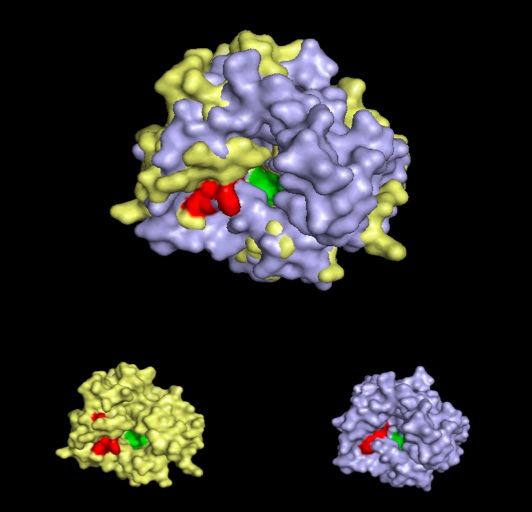
Pymol alignment of phytanoyl-CoA hydroxylase and phytanoyl-CoA dioxygenase
A pymol alignment of phytanoyl-CoA hydroxylase and phytanoyl-CoA dioxygenase showed conserved structural positions of both the iron binding site and the 2-oxogluterate binding site in the largest cleft of the dioxygenase enzyme. This is the probable active site due to the presence of both putative binding sites and good accessibility for substrates.
A STRING analysis (http://string.embl.de/) failed to find any interacting partners for phytanoyl-CoA dioxygenase and the absense of homology with phytanoyl-CoA hydroxylase prevent the inference of interactions.
Expression
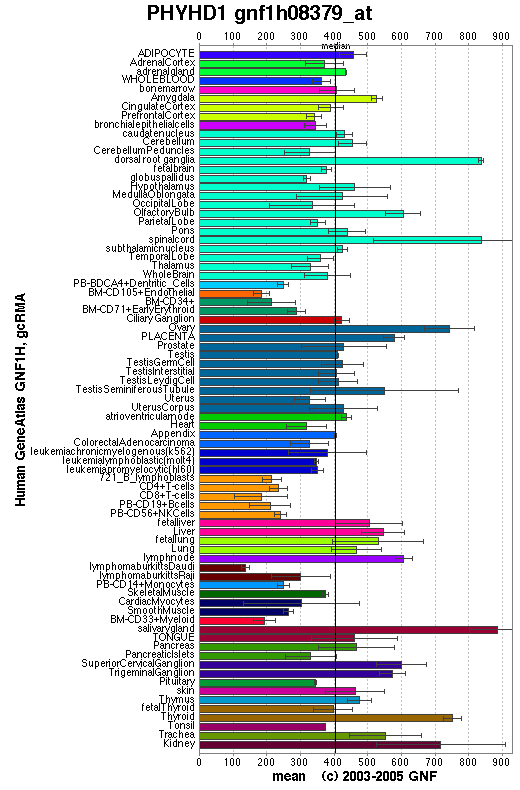
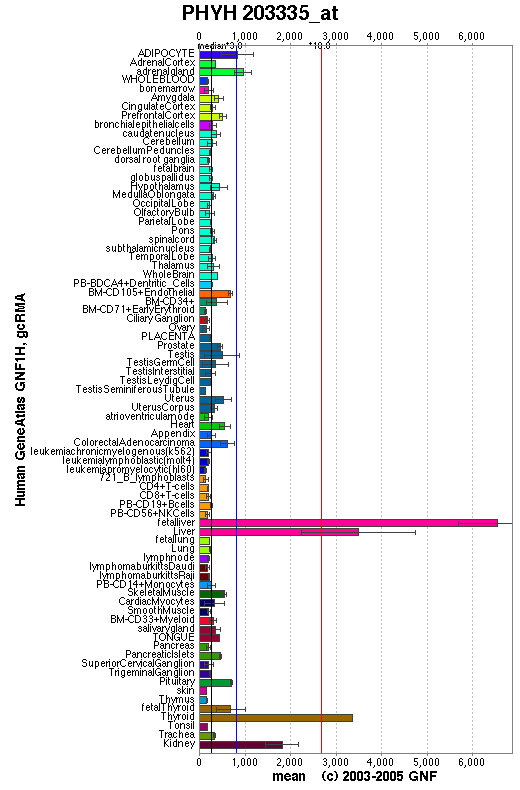
An expression profile created from the human gene atlas (http://symatlas.gnf.org) shows that phytonoyl-CoA dioxygenase (figure 3.6) is expressed in different tissues to phytanoyl-CoA hydroxylase (figure 3.7). There is increased expression of the dioxygenase enzyme in the spinal cord, dorsal ganglion and olfactory bulb whereas the hydroxylase enzyme has increase expression in adipocytes and hepatocytes.
Abstract | Introduction | Results | Discussion | Conclusion | Method | References
