Phytanoyl-CoA results
Abstract | Introduction | Results | Discussion | Conclusion | Method | References
Sequence Analysis
Multiple Sequence Alignment
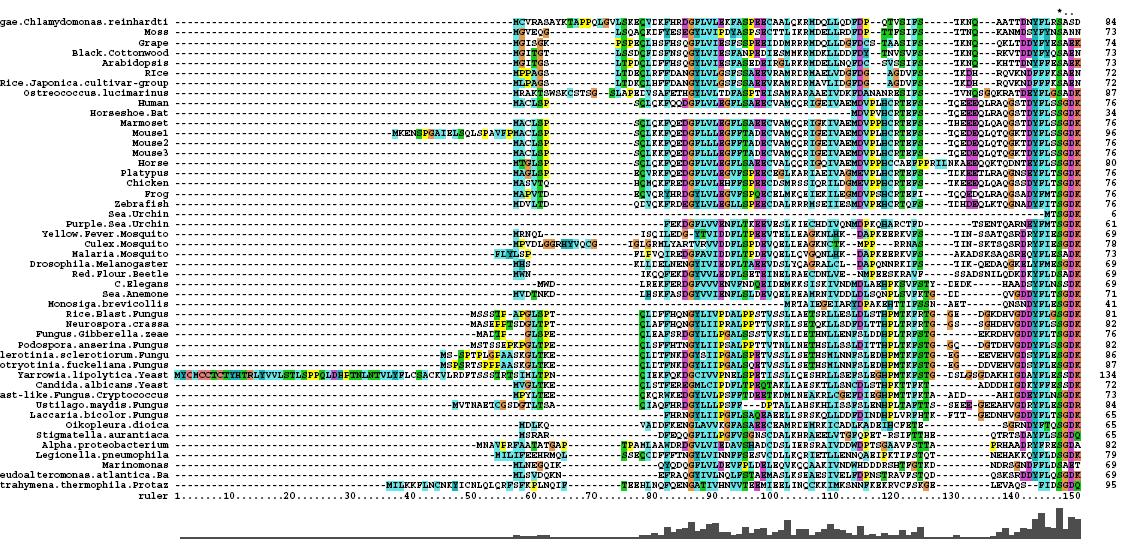
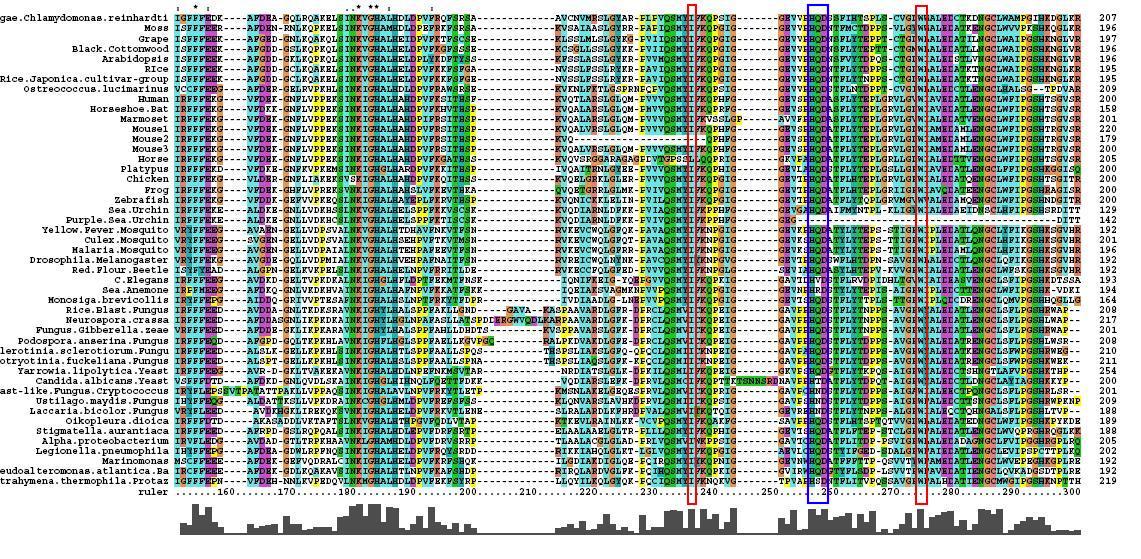
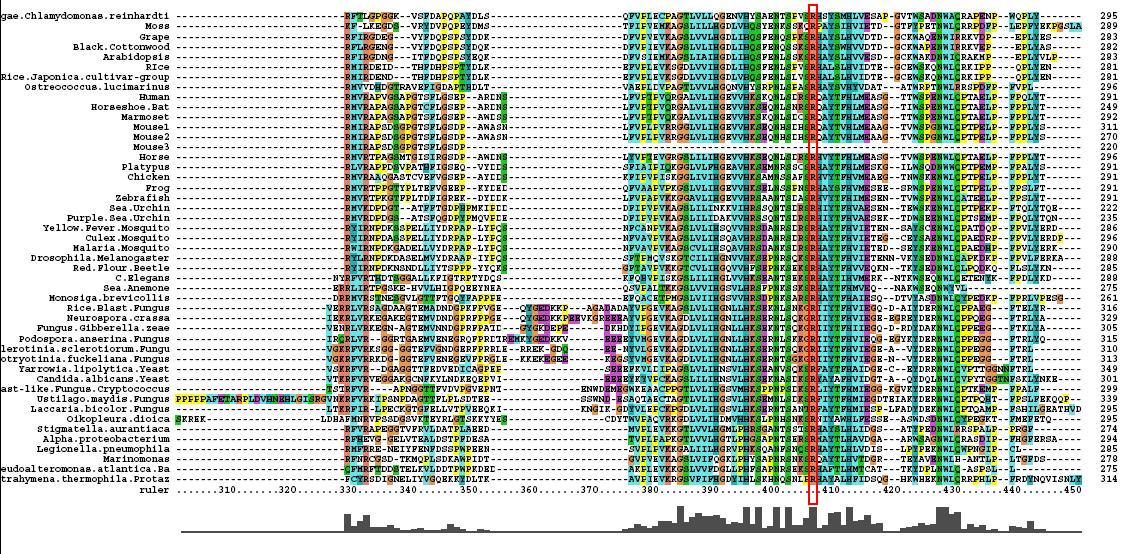
After conducting a BLAST search of the non-redundant databases, 46 analygous sequences were selected for comparison. A multiple sequence alignment was then performed on the sequences. The returned alignment was of an excellent quality with several section of high conservation being identified. The gene appears to be fairly well conserved across all species although the best similarity occurs with other mammalian species. This idicates that the protein is most likely to still have its functionality in most of these species which is remarkable given the broad range of both prokaryotes and eukaryotes investigated. In total there 5 residues conserved across all sequences but several more section of very high similarity. These include the iron binding sites (shown in red) and the 2OG binding site (shown in blue) as highlighted in Figure 1.
Phylogenetic Trees
Data obtained from the multiple sequence alignment could then be utilised to obtain a phylogenetic tree of the sequences and give an understanding of the evolutionary path of PhyD gene. After initial construction of the tree, it is easily apparent that the mammals are the most evolutionary and contain the most closely related form of the PhyD gene. This is followed by fungi which are the grouped together on the next branch of the tree. Bacteria is group further away again and lastly plants appear to be quite distantly removed from the original human gene. The two protozoans in the tree are grouped separately, one with fungi and one with bacteria, whilst the two algae are also grouped as outliers.
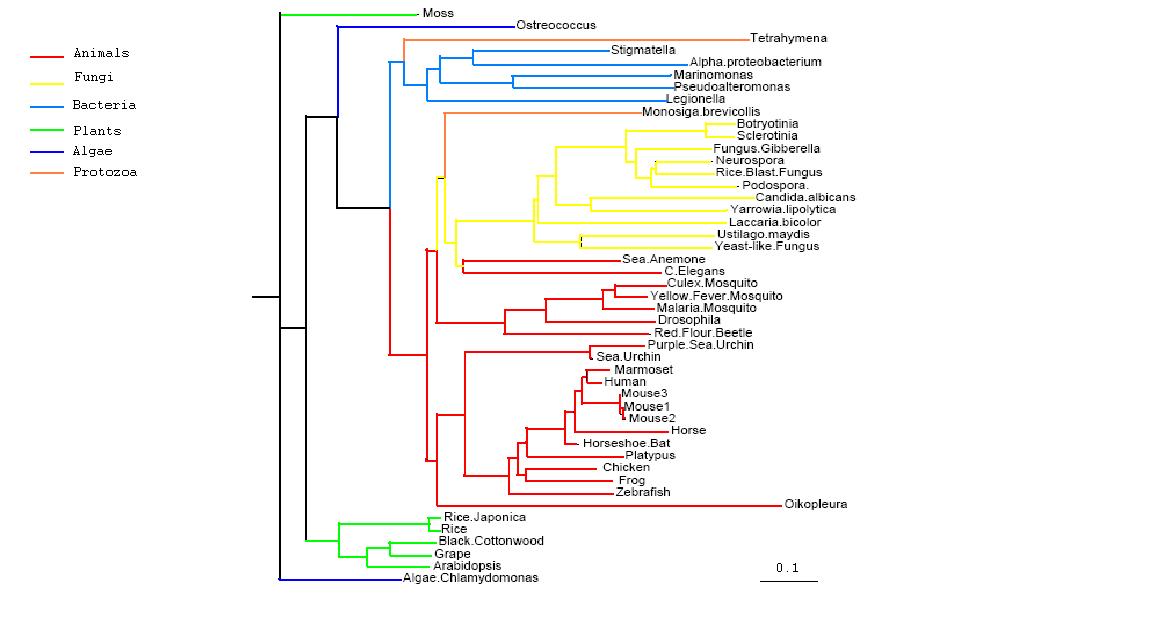
Rooted Phylogenetic Tree obtained from Phylip
Drawn using Phylodendron
http://iubio.bio.indiana.edu/treeapp/
After the tree was bootstrapped a final consensus tree was obtained which is not greatly removed from the original tree, giving added confidence in the groupings. The two protozoans have been again grouped differently, now both with the mammals however their low bootstrap values indicate that this is not a highly supported grouping. In general comparison to taxonomic grouping, our tree groups eukaryote mammals close to fungi but bacteria are also closely associated to them whilst plants are not. This seems to indicate that the function of PhyD is required most by animals and fungi or plants.
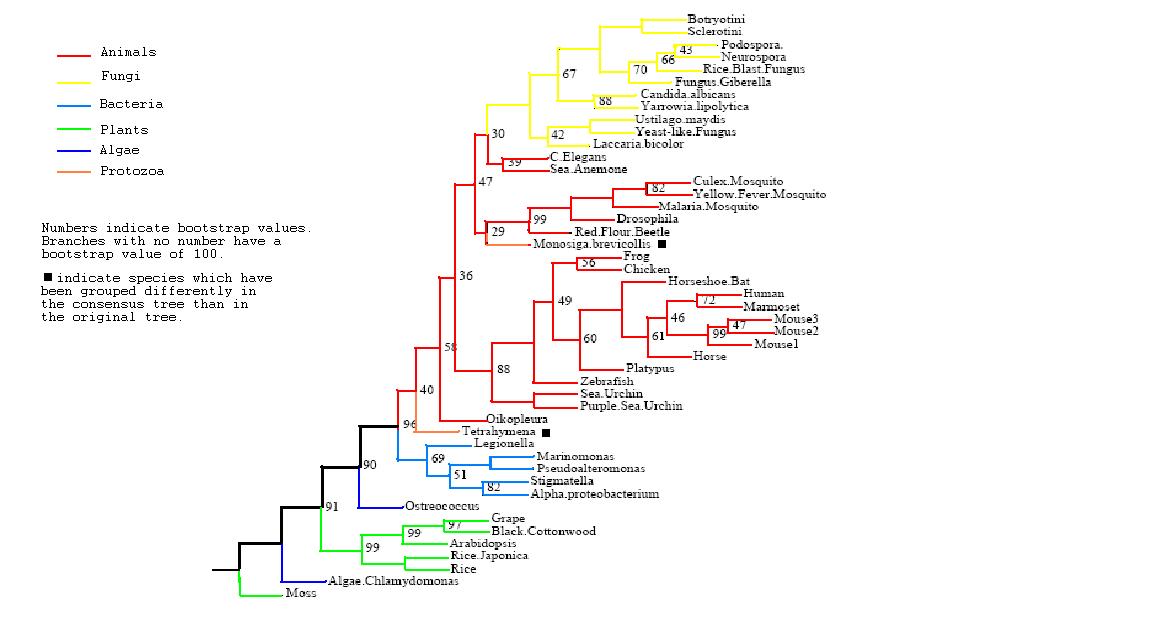
Rooted Consensus Tree with bootstrap values obtained from Phylip
Drawn using Phylodendron
http://iubio.bio.indiana.edu/treeapp/
Function Analysis
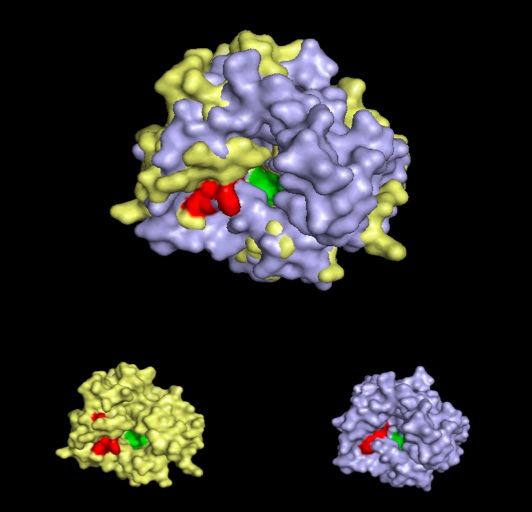
Interpro analysis showed motif similarity to the family of phytanoyl-CoA hydroxylases (PhyH) (Figure 3.1) and Secondary Structure analysis via profunc showed high structural identity to phytanoyl-CoA hydroxylase (PDB code; 2a1x) (Figure 3.2). Although the sequence homology between Phytanoyl-CoA dioxygense and the hydroxylase identified was only 24.9%, a pymol analysis showed the two enzymes to have a high structural similarity.
Pymol analysis of similarity between Phytanoyl-CoA dioxygenase and Phytanoyl-CoA hydroxylase
Fe2+ binding sites
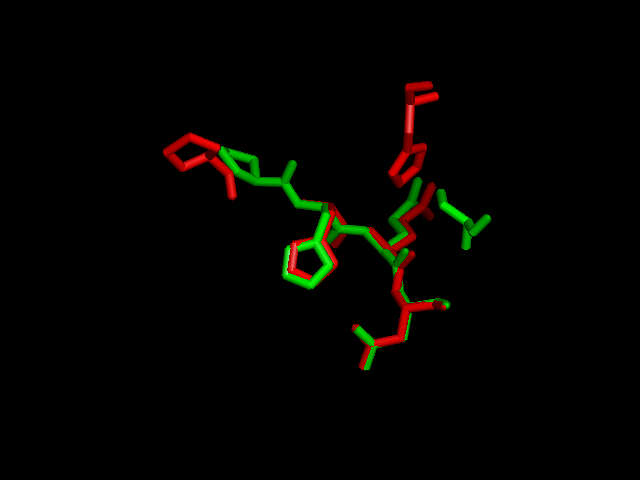
A putative iron binding site was identified in phytanoyl-CoA dioxygenase by structural comparison to the iron binding site of phytanoyl-CoA hydroxylase. Residues PRO155, HIS156, GLN157 and ASP158 show structural similarity to the PRO173, HIS175, GLN176 and ASP177 of the hydroxylase enzyme. HIS220 is also involved in iron binding in the hyroxylase but no histadine residue exist in this position in the dioxygenase. It is hypothesised that the histadine binding is replaced by a serine at position 160, which is spacially close to the histadine in the pymol alignment.
2-oxogluatarate binding site
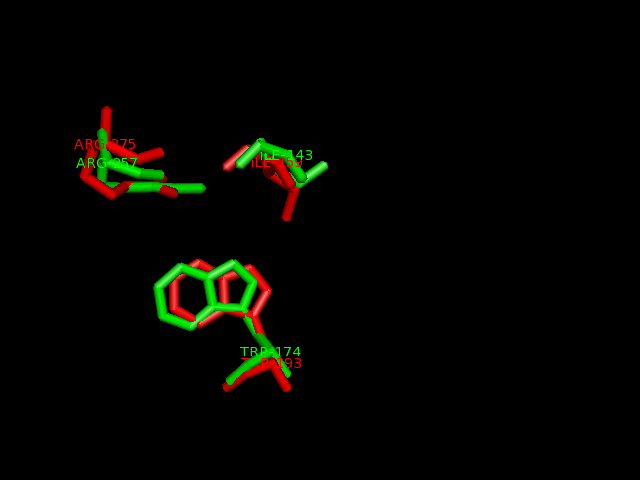
Ligand binding template results from profunc matched TRP193, ILE159 and ARG275 from hydroxylase with the TRP174, ILE143 and ARG257from the dioxygenase (e-value 1.95x10⁻⁸).
Pymol alignment of phytanoyl-CoA hydroxylase and phytanoyl-CoA dioxygenase
A pymol alignment of phytanoyl-CoA hydroxylase and phytanoyl-CoA dioxygenase showed conserved structural positions of both the iron binding site and the 2-oxogluterate binding site in the largest cleft of the dioxygenase enzyme. This is the probable active site due to the presence of both putative binding sites and good accessibility for substrates.
A STRING analysis (http://string.embl.de/) failed to find any interacting partners for phytanoyl-CoA dioxygenase and the absense of homology with phytanoyl-CoA hydroxylase prevent the inference of interactions.
Expression
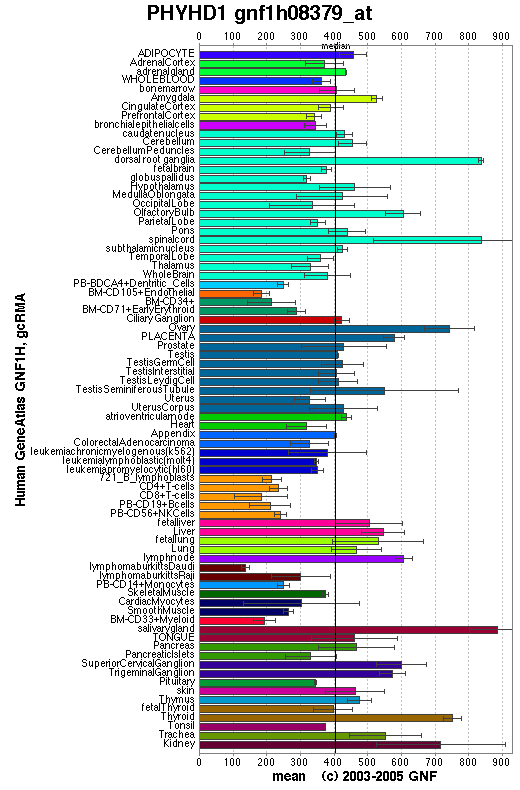
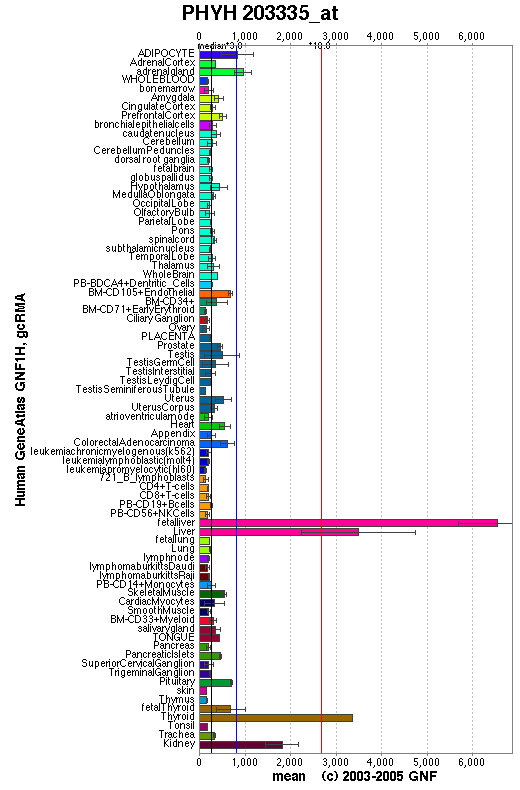
An expression profile created from the human gene atlas (http://symatlas.gnf.org) shows that phytonoyl-CoA dioxygenase (figure 3.6) is expressed in different tissues to phytanoyl-CoA hydroxylase (figure 3.7). There is increased expression of the dioxygenase enzyme in the spinal cord, dorsal ganglion and olfactory bulb whereas the hydroxylase enzyme has increase expression in adipocytes and hepatocytes.
Abstract | Introduction | Results | Discussion | Conclusion | Method | References
